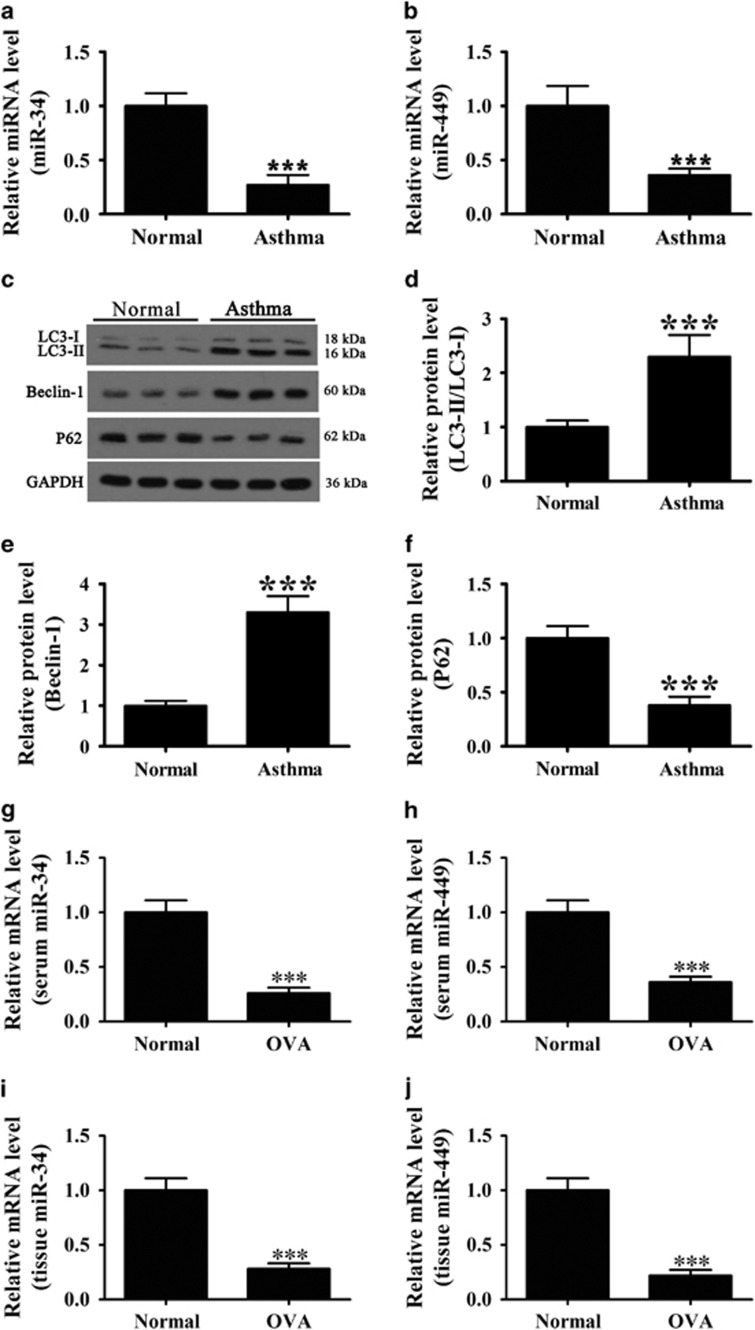
Figure 1.
Expression levels of miR-34/449 and autophagy-related proteins in asthma patients or OVA mouse. (a and b) Real-time PCR measurement of miR-34 (a) and miR-449 (b) expression in the serum from asthma patients and healthy controls. Values represent the mean±S.E.M. (n=5), *P<0.05, **P<0.01, ***P<0.001 versus normal control. (c–f) Western blot analysis of Beclin-1, LC3 and P62 in airway tissues from normal and patient groups and densitometric quantification of bands. Values represent the mean±S.E.M. (n=5), ***P<0.001 versus normal control. (g and h) Real-time PCR measurement of miR-34 (g) and miR-449 (h) expression in the serum from OVA-induced asthma mouse and healthy controls. Values represent the mean±S.E.M. (n=5), ***P<0.001 versus normal control. (i and j) Real-time PCR measurement of miR-34 (i) and miR-449 (j) expression in the tissue from OVA-induced asthma mouse and healthy controls lung tissue. Values represent the mean±S.E.M. (n=5), ***P<0.001 versus normal control

