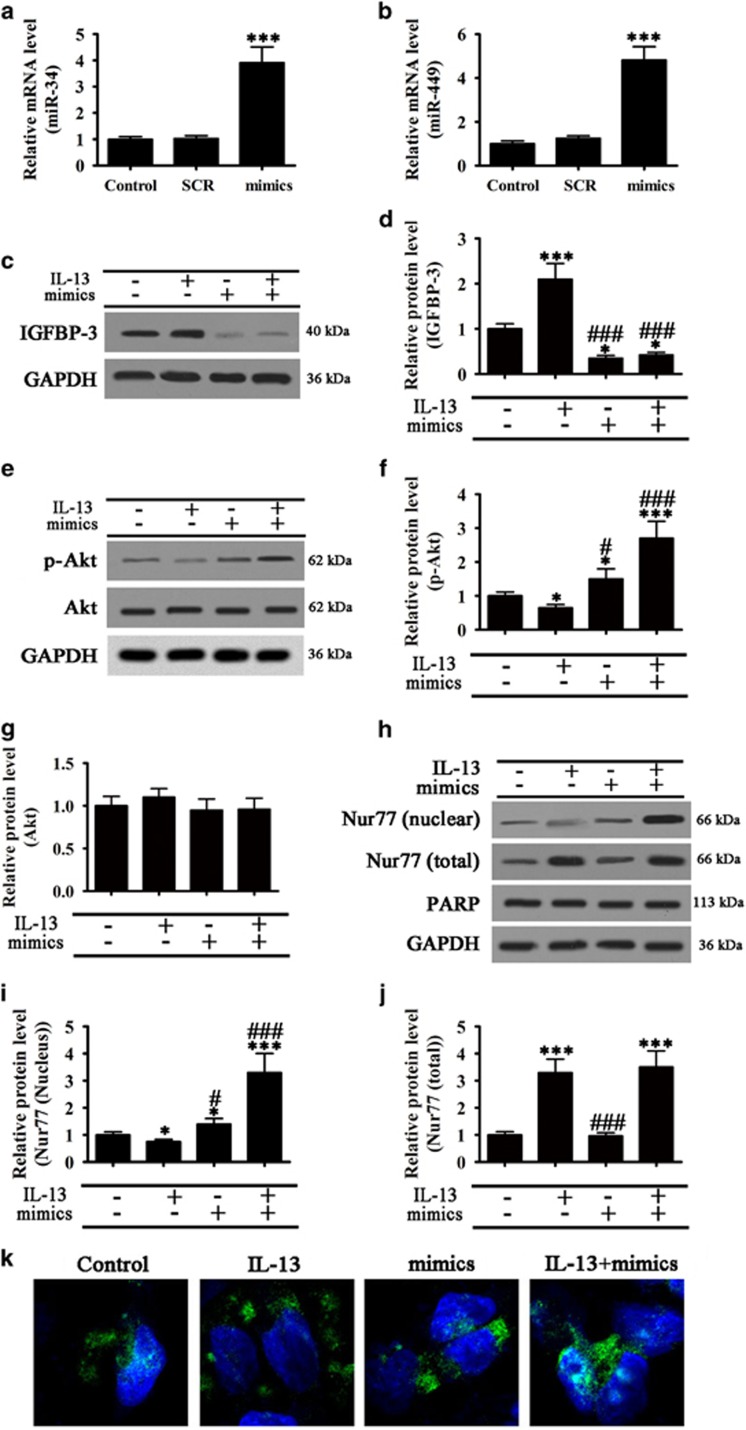
Figure 3.
miR-34/449 overexpression suppressed IL-13 induced autophagy by modulating Nur77 subcellular localization via IGFBP-3. BEAS-2B cells were transfected with miR-34/449 mimics or scrambled control mimics and (a and b) Real-time PCR show the expression of miR-34 (a) and miR-449 (b) after transfected with miR-34 and miR-449 mimics for 72 h. Values are represented as mean±S.E.M. (n=5), ***P<0.001 versus control. (c–k) BEAS-2B cells overexpressing miR-34/449 were treated with or without IL-13 for 72 h (c,d) Western blot analysis of IGFBP-3 expression and densitometric quantification. Values represent the mean±S.E.M. (n=3), *P<0.05, ***P<0.001 versus control. ###P<0.001 versus IL-13 group. (e–g) Western blot analysis of phospho-Akt and total Akt and densitometric quantification of bands. Values represent the mean±S.E.M. (n=3), *P<0.05, ***P<0.001 versus Control. #P<0.05, ###P<0.001 versus IL-13 group. (h–j) Subcellular distribution of Nur77 analyzed by western blotting. GAPDH was used as the loading control for the total fraction, whereas PARP was used as the loading control for the nuclear fraction. Bar graphs show the quantification of bands by densitometry. Values represent the mean±S.E.M. (n=3), *P<0.05, **P<0.01, ***P<0.001 versus control. #P<0.05, ###P<0.001 versus IL-13 group. (k) Representative immunofluorescence images showing the subcellular distribution of Nur77 [Nur77: green; nucleus: DAPI (blue)]

