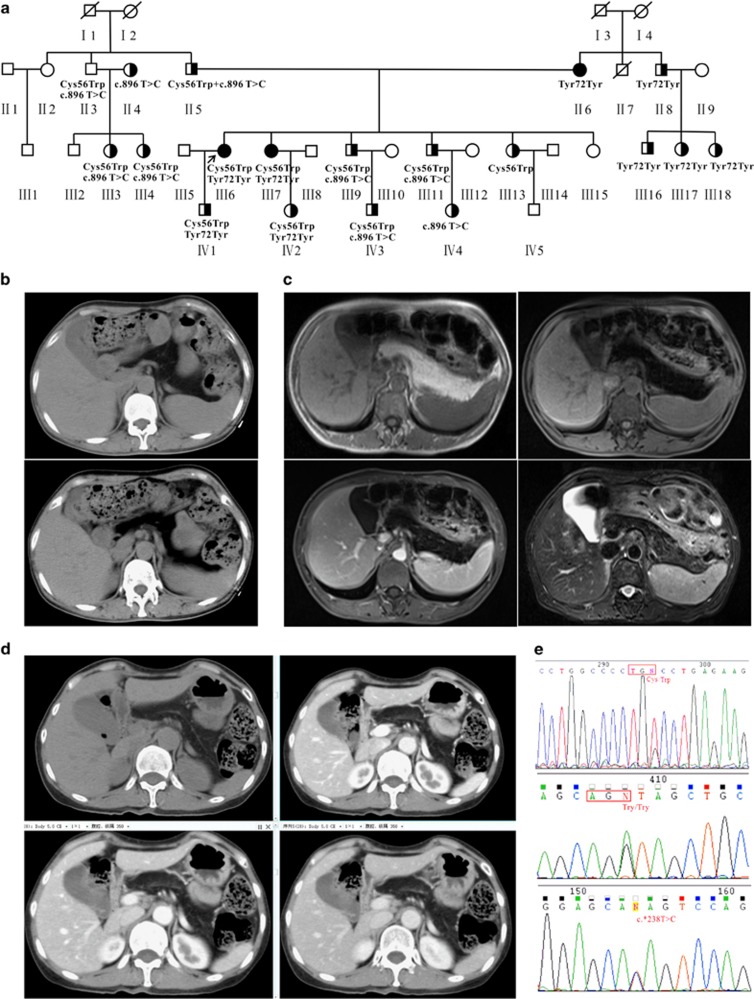
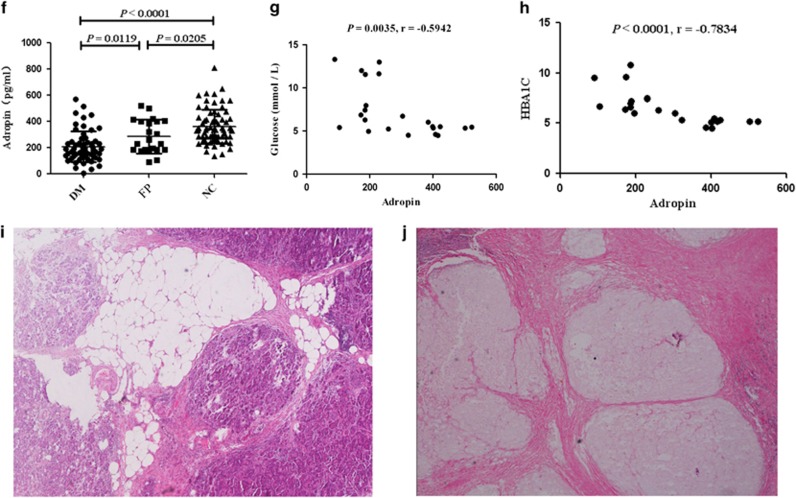
Figure 1.
Identification of Enho mutations in fatty pancreas and diabetes. (a) The pedigree of the family affected by fatty pancreas and diabetes, fatty pancreas patients (▪●), type II diabetes mellitus patients ( ) and their family normal members (○□), proband (↗). (b) Computed tomography (CT) revealed total homogenous replacement of the pancreas by fat (top), fat-suppression showed pancreatic signal reduction and decreased pancreatic parenchyma (bottom). (c) MRI T2WI and T1WI showed fatty tissues were seen within the region of the pancreas from the proband (III6). Left top: T1WI, Left bottom: T1WI fat-suppression (enhanced), Right top: T1WI fat-suppression, Right bottom: T2WI fat-suppression. (d) Patient III7, the sister of the proband: CT and CT enhanced scan showed pancreas morphology remained visible and pancreatic duct resulted in a fishbone like change, normal pancreatic tissue was substituted by adipose tissue. (e) p.Cys56Trp, p.Tyr72Tyr, and c.*238T>C mutations which were validated by Sanger sequencing. (f) The medium levels of serum adropin before therapy in the patients with fatty pancreas and diabetes and that of the healthy subjects. (g) Serum adropin inversely associated with glucose. (h) Serum adropin inversely associated with HbA1c. (i) Pancreatic steatosis is histologically characterized by an increased number of adipocytes or expansion of existing adipocyte size (III7). (j) Fibrosis and fat in intralobular locations in the pancreatic tissue (III6)


