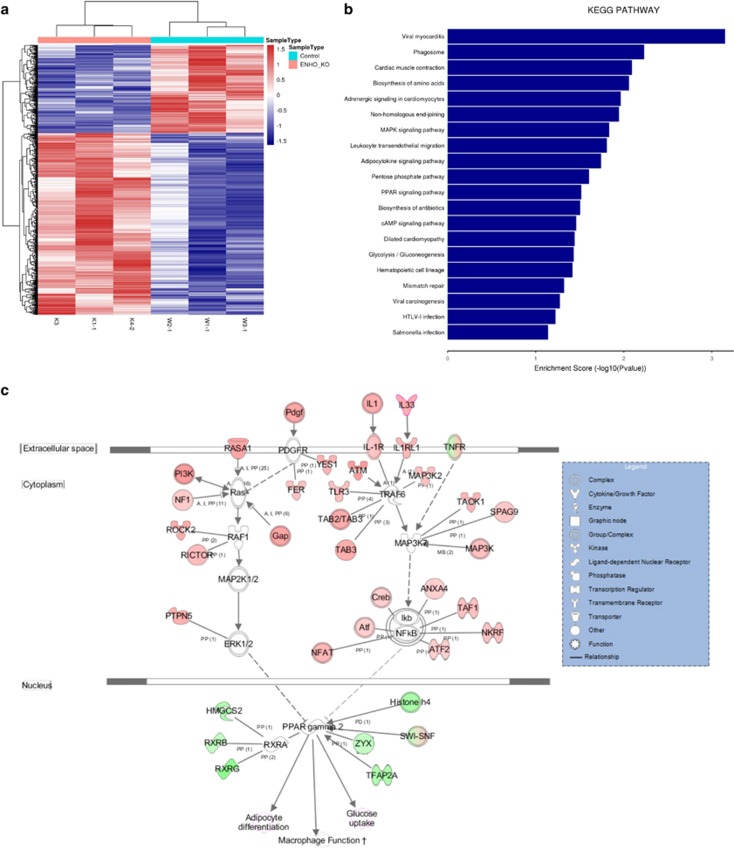
Figure 5.
Expression profiling of pancreatic tissue isolates by RNA-SEQ. (a) The heatmap depicts hierarchical clustering based on the 973 differentially expressed genes. Unsupervised hierarchical clustering was done with complete linkage. Heatmap visualization for the pancreatic tissues of AdrKO mice and WT mice (n=3). Rows: samples; Columns: metabolites; Color key indicates metabolite expression value, blue: lowest; red: highest. (b) Importantly KEGG (Kyoto Encyclopedia of Genes and Genomes) pathway mapping of the entire set of differentially expressed genes revealed highly significant molecular interactions for KEGG entries Glycosphingolipid biosynthesis-lacto and neolacto series, Ubiquinone and other terpenoid-quinone biosynthesis. X-axis is an inverse indication of P-value or significance. (c) IPA signaling pathway analysis of potential intervention targets of adropin-deficiency. Ingenuity analysis of top pathways affected in differentially expressed genes between AdrKO and controls, mRNAs (FDR 10%, FC >1.5). Red symbols specify upregulated expression of genes, whereas green symbols indicate downregulated genes. The color darkness represents the FC intensity

