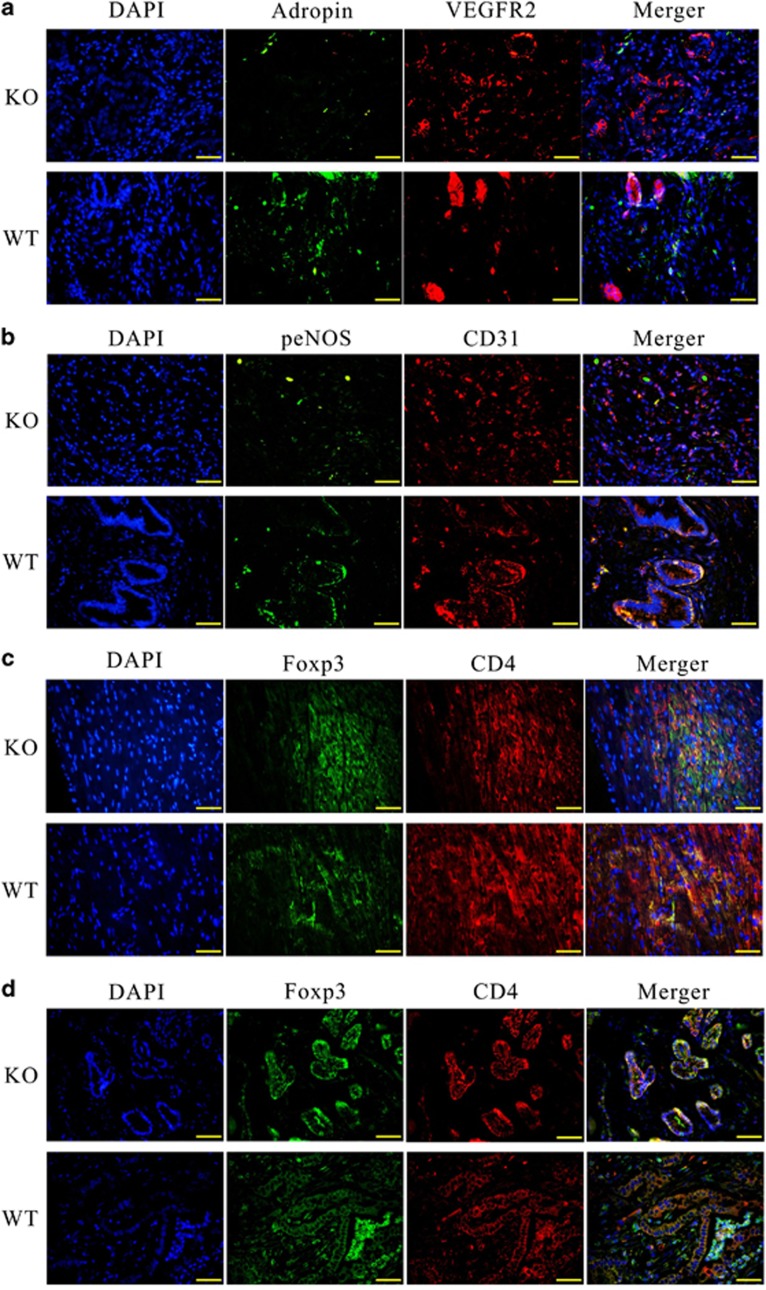
Figure 7.
Adropin-deficiency results in loss of p-eNOS and Treg cells. (a) Confocal immunofluorescence analysis showing diminutive areas of colocalized DNA in blue, adropin in green and VEGFR2 in red, the overlap of adropin and VEGFR2 (yellow staining in the merged image). (b) Confocal immunofluorescence analysis showing small areas of co-localized DNA in blue, CD31 in red and p-eNOS in green, overlap of CD31 and p-eNOS (yellow staining in the merged image) in the endothelial layers. (c) Colocalization of DNA (blue), CD4 (red) and Foxp3 (green) indicates Treg cells formation in myocardial. (d) Colocalization of DNA (blue), CD4 (red) and Foxp3 (green) indicates Treg cells formation in pancreatic tissues. Original magnification: × 400

