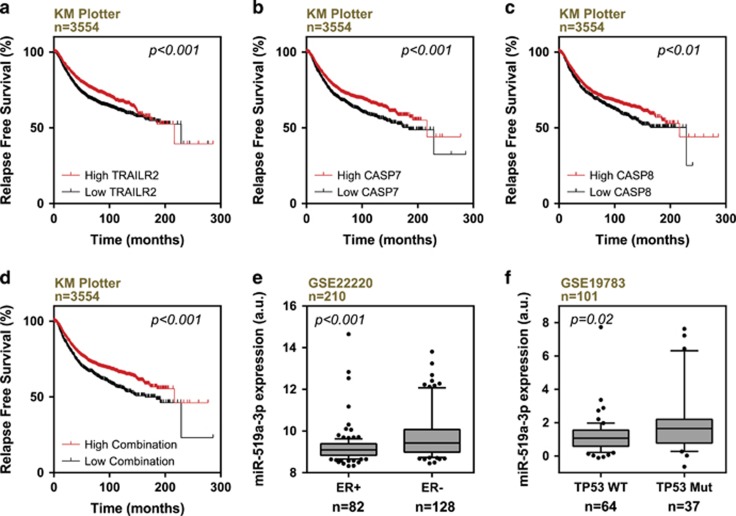
Figure 5.
Correlation of CASP7/8 and TNFRSF10B levels with survival outcome and miR-519a-3p with mutant TP53 expression. (a–c) Low expression of TNFRSF10B, CASP7 and CASP8 (black curves) correlate with poorer survival of breast cancer patients (KM Plotter). (d) Lower combined mean expression of TNFRSF10B, CASP7 and CASP8 expression (black curve) correlate with poorer survival of breast cancer patients (KM Plotter). (e) Analysis of breast cancer patient data set GSE22220 revealed that miR-519a-3p is higher expressed in estrogen receptor-negative (ER−) compared with estrogen receptor-positive (ER+) tumors. (f) Analysis of breast cancer patient data set GSE19783 revealed that miR-519a-3p is higher expressed in tumors with mutated in TP53 (TP53 Mut) than in tumors with wild-type TP53 (TP53 WT)

