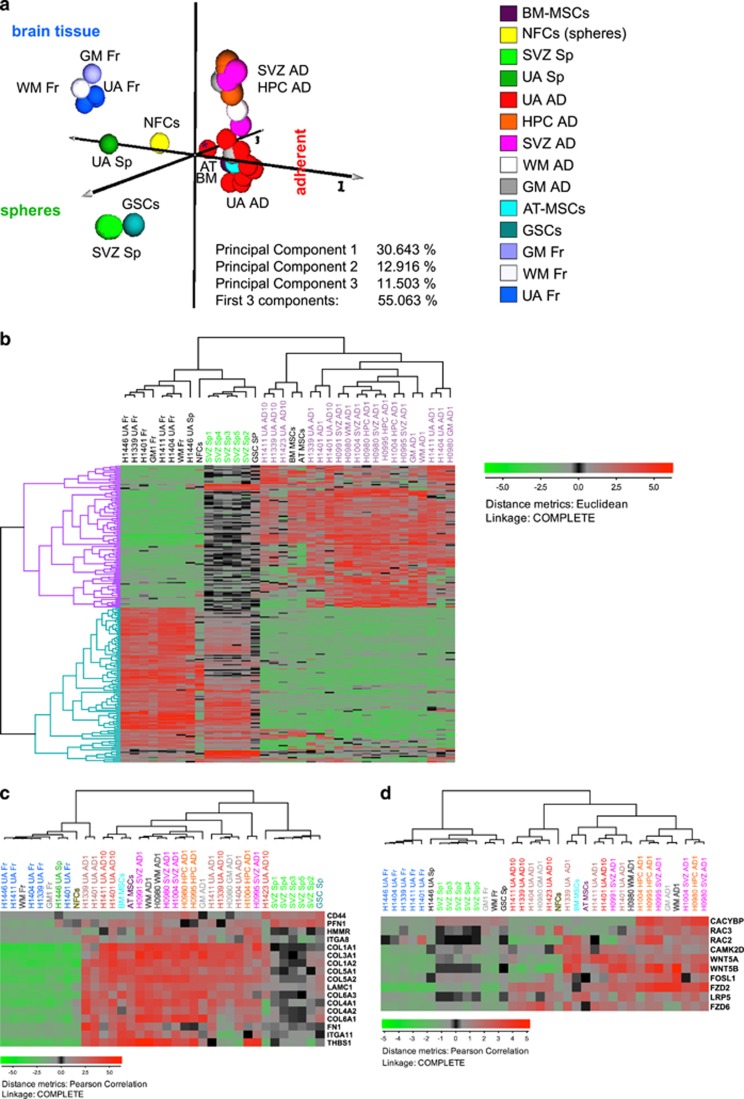
Figure 5.
Global mRNA profiling showing the difference between fresh cells from UA samples of adult human brain and those enriched under different culture conditions. Patient samples were grouped in response to culture conditions showing some difference between UA samples and those from SVZ and hippocampus (HPC). (a) Global PCA analysis. To visualize similarities or dissimilarities between samples, we used global principal component analysis (PCA) of gene expression. Each individual sample is represented with a ball of a certain color. Principal components PC1, PC2 and PC3 were represented as axes 1–3. While the PC1 separated fresh tissues (up to the left) from neurospheres (down to the left) and adherent cell cultures incubated in serum-containing medium (right), the second PC stratified the cluster of adherent cell cultures. PC2 thus roughly separated UA samples (bottom) from the adherent cell cultures originating from neurogenic regions of the human brain such as SVZ, HPC, WM and GM. The adipose tissue MSCs and bone marrow MSCs clustered together with the serum-grown UA cell cultures. Meanwhile the sphere cultures expanded from the SVZ, SVZ-Sp, (lighter shades of green) clustered tightly together (and in the proximity of a GSC sample), the sphere culture expanded from UA (UA-Sp) (darker shade of green) clustered closer to fresh tissues (Fr). (b) Spheres and adherent cultures express different sets of genes. HCA and stringent filtering identified 224 differentially expressed genes (DEGs) with the most variable expression between the groups of spheres (SVZ-Sp) and the serum-grown adherent cell cultures (such as UA-AD, SVZ-AD, GM-AD, WM-AD and HPC-AD). These two groups are specified with the green and darker shade of orchid dendrogram colors respectively (upper panel). Dendrogram branches on the left represent genes upregulated (lilac) and downregulated in the adherent cultures (turquoise). Low expression is shown with green color while high expression is shown in red. The expression values were log2 transformed. (c and d) Pathway analysis. Several biochemical signaling pathways such as ECM-receptor interaction (c) and Wnt signaling pathways (d) are differentially expressed in spheres and adherent cell cultures. These pathways were identified using functional annotation analysis (https://david.ncifcrf.gov). In (c and d) are shown that both pathways are upregulated in the adherent cells. It is especially interesting that the canonical Wnt signaling that is traditionally associated with cancers (such as GBM) and brain development is active in the normal brain cell cultures

