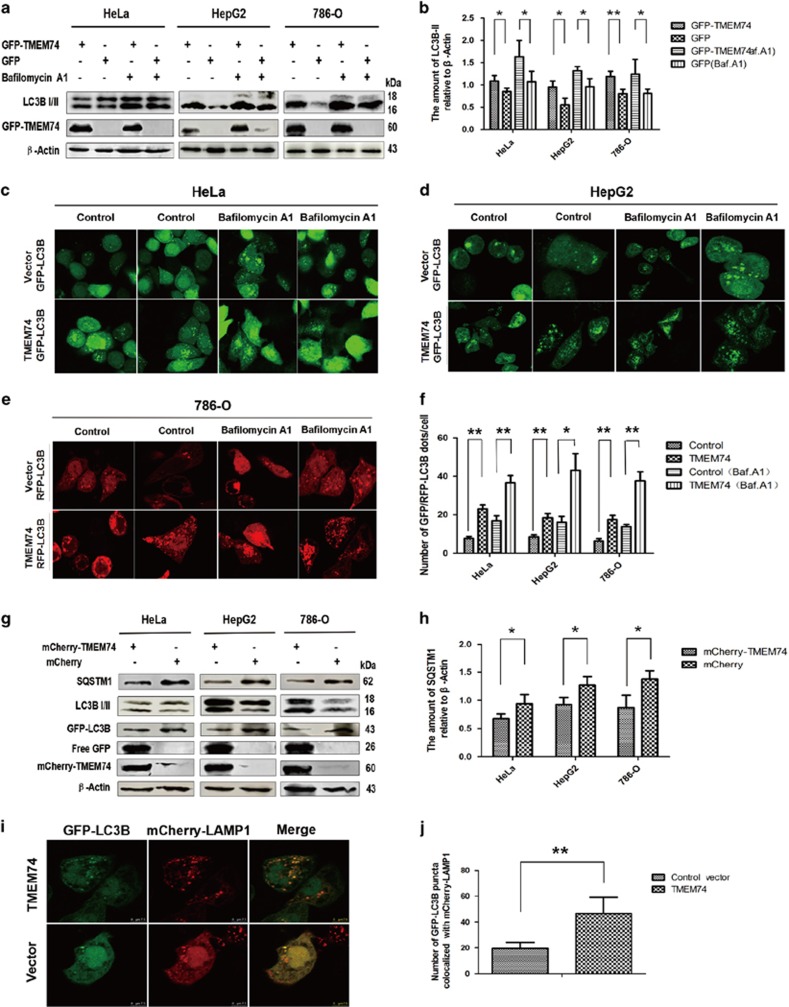
Figure 1.
TMEM74 overexpression induces cell autophagy and increases autophagic flux. (a) HeLa cells, HepG2 cells and 786-O cells were transfected with GFP-TMEM74 or GFP plasmids (control) for 24 h, and treated with bafilomycin A1 (100 nM) for at least 12 h. The levels of LC3B-II were measured by western blotting. (b) Quantification of LC3B-II levels relative to β-Actin was shown as column. Data are means±S.D. of three experiments. *P<0.05, **P<0.01. (c,d) HeLa cells and HepG2 cells were co-transfected with GFP-LC3B and mCherry-TMEM74 or GFP-LC3B and mCherry (control), and treated with Bafilomycin A1 (100 nM) for at least 12 h.Representative confocal microscopy images of GFP-LC3B distribution were shown. (e) 786-O cells were co-transfected with GFP-LC3B and GFP-TMEM74 or RFP-LC3B and mCherry (control), and treated with Bafilomycin A1 (100 nM) for at least 12 h.Representative confocal microscopy images of RFP-LC3B distribution were shown. (f) Quantification of GFP-LC3B or RFP-LC3B punta per cell was shown as column. Data are means±S.D. of at least 20 cells scored from at least three observed regions.*P<0.05, **P<0.01. (g) HeLa cells, HepG2 cells, and 786-O cells were co-transfected with mCherry-TMEM74 and GFP-LC3B or mCherry (control) and GFP-LC3B for 24 h respectively. Levels of SOSTM1, free GFP, and endogenous LC3B-II were analyzed by western blotting. (h) Quantification of SQSTM1 levels relative to β-Actin was shown as column. Data are means±S.D. of three experiments. *P<0.05, **P<0.01. (i,j) Colocalization of GFP-LC3B with mCherry-LAMP1 obtained from the HeLa cells co-transfected with TMEM74, GFP-LC3B and mCherry-LAMP1 or control vector, GFP-LC3B and mCherry-LAMP1 for 24 h, respectively, and then observed by confocal microscopy. Quantification of the GFP-LC3B puncta colocalized with mCherry-LAMP1 was shown as column. Data are means±S.D. of the cells from at least three observed regions.*P<0.05, **P<0.01

