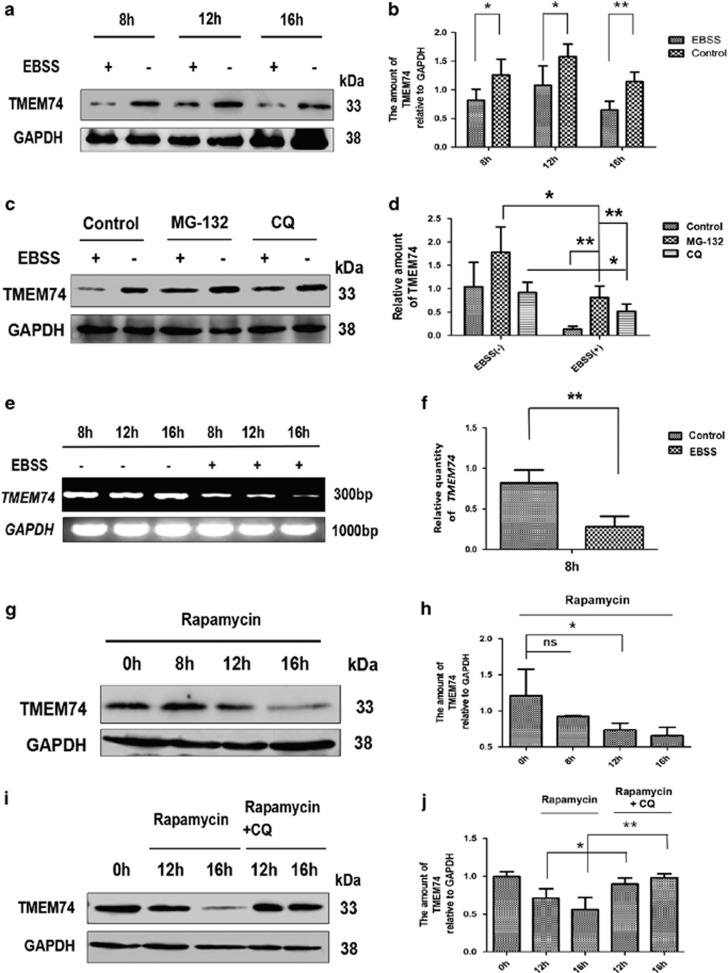
Figure 8.
The expression of TMEM74 in the autophagic process. (a,b) Western blotting analysis of endogenous TMEM74 levels in HeLa cells treated by EBSS (8, 12, 16 h). Quantification of TMEM74 levels relative to GAPDH was shown as column. Data are means±S.D. of three experiments. *P<0.05, **P<0.01. (c,d) Western blotting analysis of endogenous TMEM74 levels in HeLa cells treated by EBSS for 8 h with/without MG-132 (10 μM) or CQ (25 μM). Quantification of TMEM74 levels relative to GAPDH was shown as column. Data are means±S.D. of three experiments. *P<0.05, **P<0.01. (e,f) HeLa cells were treated with EBSS (8, 12, 16 h). the levels of TMEM74 were detected by RT-PCR and Q-PCR, respectively. (g,i) Western blotting analysis of endogenous TMEM74 levels in HeLa cells treated by rapamycin (500 nM) for 8,12 and 16 h with/without CQ (25 μM) for 12 and 16 h. (h,j) Quantification of TMEM74 levels relative to GAPDH was shown as column. Data are means±S.D. of three experiments. *P<0.05, **P<0.01

