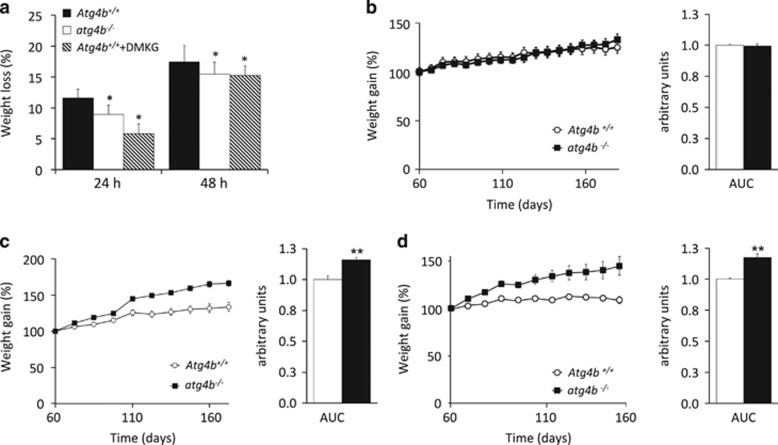
Figure 1.
Effects of systemic autophagy deficiency on weight changes induced by starvation and hypercaloric dietary regimens. (a) atg4b−/− Mice show reduced weight loss (depicted as the percentage of the initial weight) upon either 24- or 48-h of starvation, as compared with age-matched WT littermates. This was also observed in control mice treated with the autophagy inhibitor dimethyl-α-ketoglutarate (DMKG). (b) Weight curves of WT or atg4b−/− mice fed ad libitum with standard rodent diet without any supplementation in drinking water. Bar graph shows area under the curves (AUC). (c) Weight curves of WT or atg4b−/− mice fed ad libitum with a high-fat diet containing 42% fat and without any supplementation in drinking water. Bar graph shows AUC. (d) Weight curves of WT and atg4b−/− mice fed ad libitum with standard rodent diet with 30% sucrose supplementation in drinking water. Bar graph shows AUC. For starvation-related experiments in mice, at least 6 animals per genotype/condition were used. For specific diets experiments in mice, at least 12 animals per genotype/condition were used. *P-value <0.05 and **P-value <0.01 in two-tailed student’s t-test for each of the depicted points

