Figure 2.
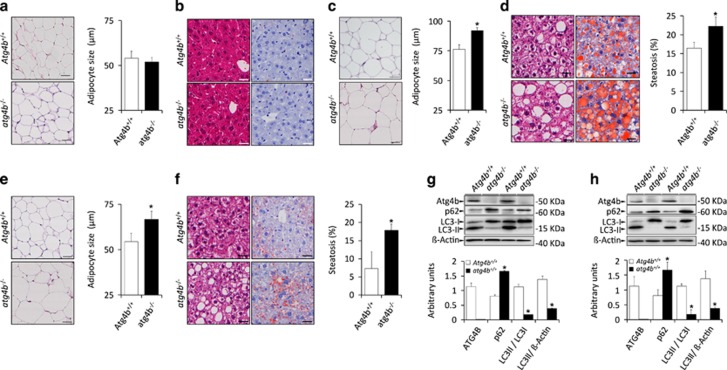
Obesity-related features of atg4b−/− mice fed with hypercaloric regimens. (a) Left, representative pictures of adipocytes from H&E sections of white adipose tissue in untreated WT and atg4b−/− mice. Right, quantification of the data. (b) Left, representative pictures from H&E sections (left) and Oil Red staining (right) of livers from untreated WT and atg4b−/− mice showing the absence of hepatic steatosis. (c) Left, representative pictures of adipocytes from H&E sections of white adipose tissue in WT and atg4b−/− mice upon high-fat diet. Right, quantification of the data. (d) Left, representative pictures from H&E sections (left) and Oil Red staining (right) of livers from WT and atg4b−/− mice upon high-fat diet showing an increase of hepatic steatosis in atg4b−/− mice. Right, quantification of the data. (e,f) Representation of equivalent data to those shown in c and d for sucrose-treated WT and atg4b−/− mice. (g,h) Immunoblotting analyses of ATG4B, SQSTM1/p62 and LC3B in white adipose (g) and liver (h) tissues from mice subjected for 60 days to high-fat diet, showing the absence of ATG4B protein, the reduction of autophagosome-associated LC3B-II and the accumulation of the specific autophagic substrate SQSTM1/p62, all indicative of reduced autophagic flux. Graph bars show quantification of the data depicted in Immunoblotting panels. *P-value <0.05 in two-tailed student’s t-test. Scale bars, 30 μm

