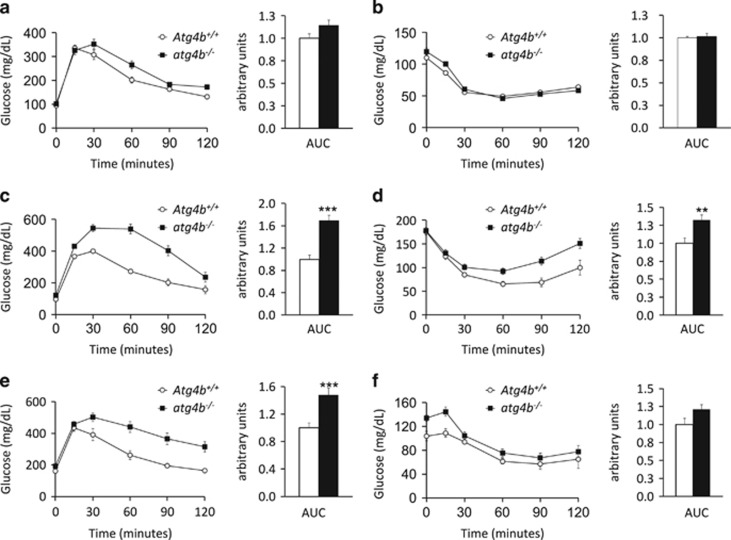
Figure 3.
Glucose- and insulin-tolerance in atg4b−/− mice fed with hypercaloric regimens. (a) Intraperitoneal glucose tolerance test (IPGTT), and (b) intraperitoneal insulin tolerance test (IPITT), in untreated WT and atg4b−/− mice (n=6). (c,d) Intraperitoneal glucose test tolerance (IPGTT), and intraperitoneal insulin tolerance test (IPITT), in WT and atg4b−/− mice upon high-fat diet (n=6). (e,f) Equivalent analyses in sucrose-treated WT and atg4b−/− mice (n=6). Bar graph shows area under the curves (AUC). Error bars represent means±S.E.M. *P-value<0.05

