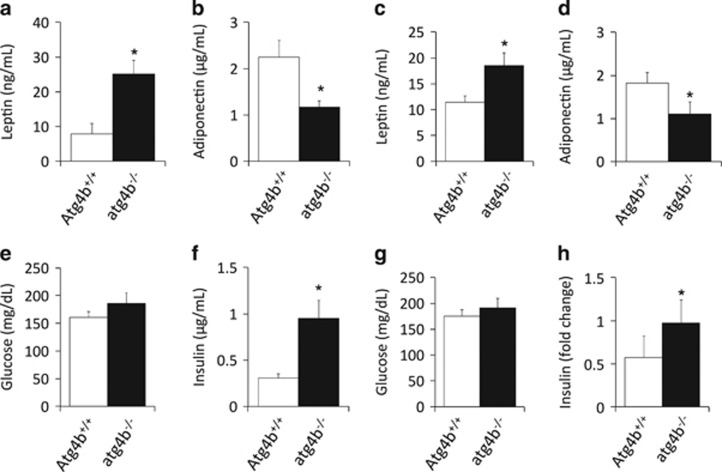
Figure 4.
Analysis of obesity-linked biochemical parameters in atg4b−/− mice. (a-d) Circulating levels of leptin (a and c) and adiponectin (b and d) in high-fat fed (a and b) and sucrose-treated atg4b−/− mice (c and d), as compared with their corresponding age-matched WT controls (n=6). (e–h) Blood glucose levels (e and g) and plasma insulin levels (f and h) in in high-fat fed (e and f) and sucrose-treated WT and atg4b−/− mice (g and h). Bars represent means±S.D. (n=6). *P-value<0.05

