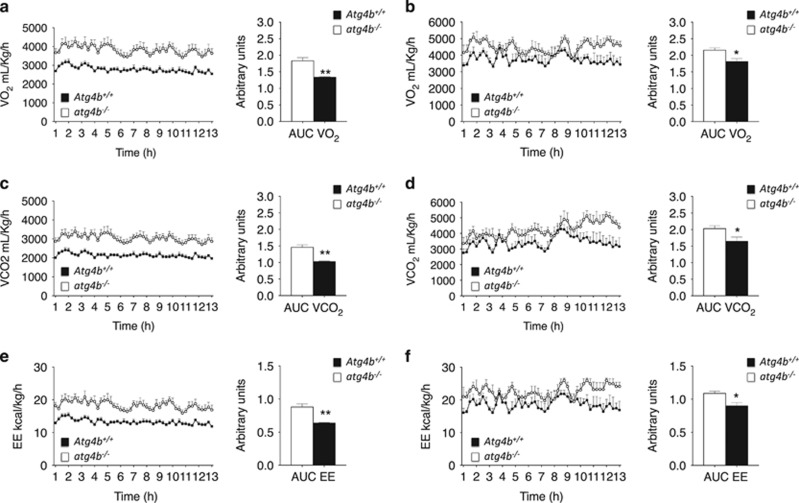
Figure 5.
Analysis of respiration and energy expenditure in atg4b−/− mice fed upon high-calorie regimens. (a) VO2 consumption (ml/kg/hour) during dark phase (12 h) (left) and area under the curve of the VO2 consumption (right) for WT and Atg4b-null mice upon high-fat diet (n=4). (b) Same representation as in a for sucrose-treated WT and Atg4b-null mice. (c,d) VCO2 production for WT and Atg4b-null mice fed with high-fat diet (c), or sucrose treated (d) (n=4). (e,f) Energy expenditure (Kcal/kg/hour) during dark phase (12 h) and area under the curve of the energy expenditure (right) for WT and Atg4b-null mice fed with high-fat diet (e), or sucrose treated (f) (n=4). Data represent mean±S.E.M. *P<0.05, **P<0.01

