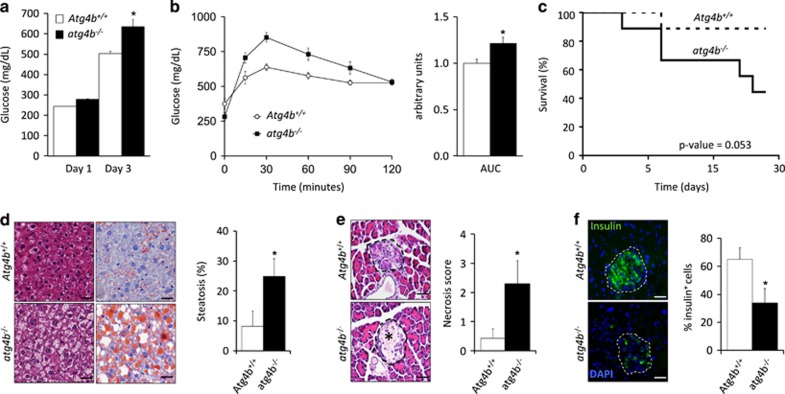
Figure 6.
atg4b−/− mice are more prone to streptozotocin-induced type-I diabetes. (a) Blood glucose levels of streptozotocin (STZ)-treated WT and atg4b−/− mice at day 1 and day 3 after STZ injection (n=8). (b) Intraperitoneal glucose tolerance test (IPGTT) in STZ-treated WT and atg4b−/− mice at day 3. Bar graph shows areas under curve (AUC) (n=8). (c) Kaplan–Meier graph of STZ-treated WT and atg4b−/− mice showing a significant increment of mortality in the absence of ATG4B. (n=8). (d) Left, representative pictures from H&E sections (left panels) and Oil Red staining (right panels) of livers from STZ-treated WT and atg4b−/− mice at day 3. Right, quantification of the data. Scale bars, 30 μm. (e) Representative pictures from H&E sections of pancreatic β-cell islets at day 3 after STZ treatment (left). β-cell islets are surrounded by dashed lines. Necrotic area is marked by an asterisk. Right, quantification of necrotic stage in these samples. Scale bars, 60 μm. (f) Immunofluorescence analysis against insulin showing specific loss of β-cell in atg4b−/− at day 3 after STZ treatment (left). β-cell islets are surrounded by dashed lines. Right, quantification of the data. Data represent mean±S.E.M. *P-value<0.05. Scale bars, 60 μm

