Figure 1.
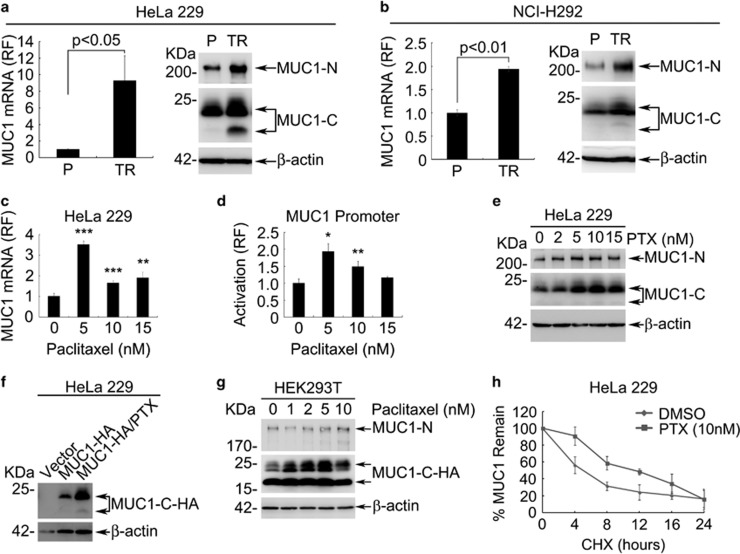
MUC1 expression is induced during acquired chemoresistance. (a) The mRNA and protein levels of MUC1 in HeLa229 parent (P) and HeLa229/TR (TR) cells were measured by RT-qPCR (left) and western blot (right). (b) The mRNA and protein levels of MUC1 in NCI-H292 parent (P) and PTX-resistant NCI-H292/TR (TR) cells were measured by RT-qPCR (left) and western blot (right). (c) HeLa229 cells were treated with different doses of PTX for 48 h. RT-qPCR was carried out to identify the mRNA of MUC1. (d) HeLa229 cells were transfected with pGL3-MUC1 promoter (500 ng) then treated with indicated dose of PTX for 48 h. The relative folds of luciferase activity were calculated against 0 nM PTX treatment (line 1). (e) HeLa229 cells were treated with different doses of PTX for 48 h. Western blot was carried out to identify the protein of MUC1. (f) HeLa229 cells were transfected with pIRESpuro2-MUC1-HA (MUC1-HA) or vector plasmids. Twenty-four hours after transfection, cells expressing MUC1-HA were treated with DMSO (0 nM) or 10 nM PTX for another 24 h, then western blot was carried out to identify the accumulation of exogenous HA tagged MUC1-C. (g) HEK293T cells were transfected with pIRESpuro2-MUC1-HA and stable expression clone was selected. The cells were treated with indicated doses of PTX for 48 h. Western blot was carried out to identify the expression of MUC1. (h) HeLa229 cells were treated with DMSO (0 nM) or 10 nM PTX for 48 h, then exposed to cycloheximide (CHX) (50 μg/ml) for indicated time. Western blot was carried out, the remaining level of MUC1-C was quantified by Image Studio Lite, version 3.1 (Li-Cor, Lincoln, NE, USA) and then compared with the initial level (0 h). The half-life curve was the average of three independent experiment. Data are shown of three independent experiments, mean±S.D. (n=3)

