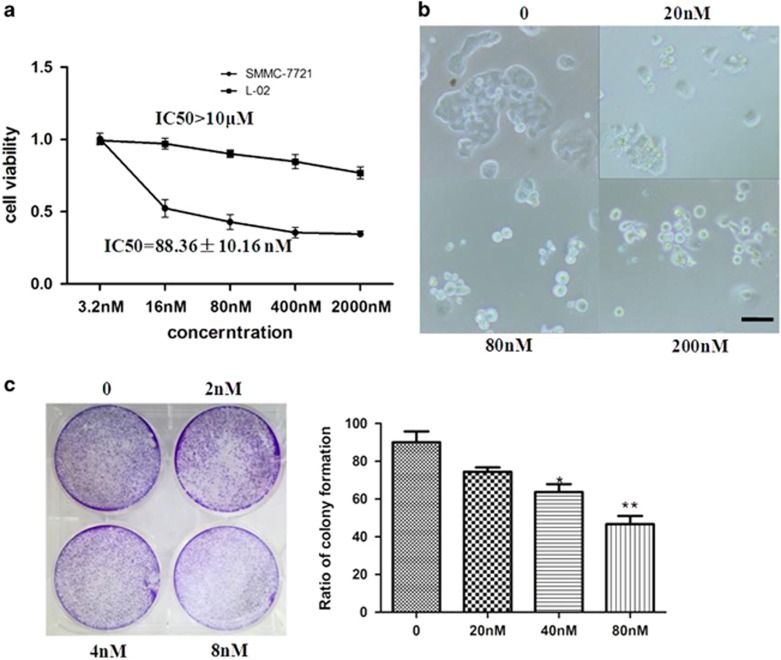
Figure 2.
Cell viability. (a) Cell viability after 48 h treatment of SMMC-7721 and L-02 cells with different concentrations of the title compound as estimated by MTT. (b) Morphology of SMMC-7721 cells viewed using inverted phase-contrast microscope (magnification × 200). SMMC-7721 cells treated with title compound (20, 40, and 200 nm) for 48 h. (c) SMMC-7721 cells were treated with control (no treatment), 2, 4, and 8 nM for 7 days. For the statistics of each panel in this figure, data are expressed as mean±S.D. (n=3). Scale bars are 50 μm. *P<0.05 versus control and **P<0.01 versus control

