Figure 7.
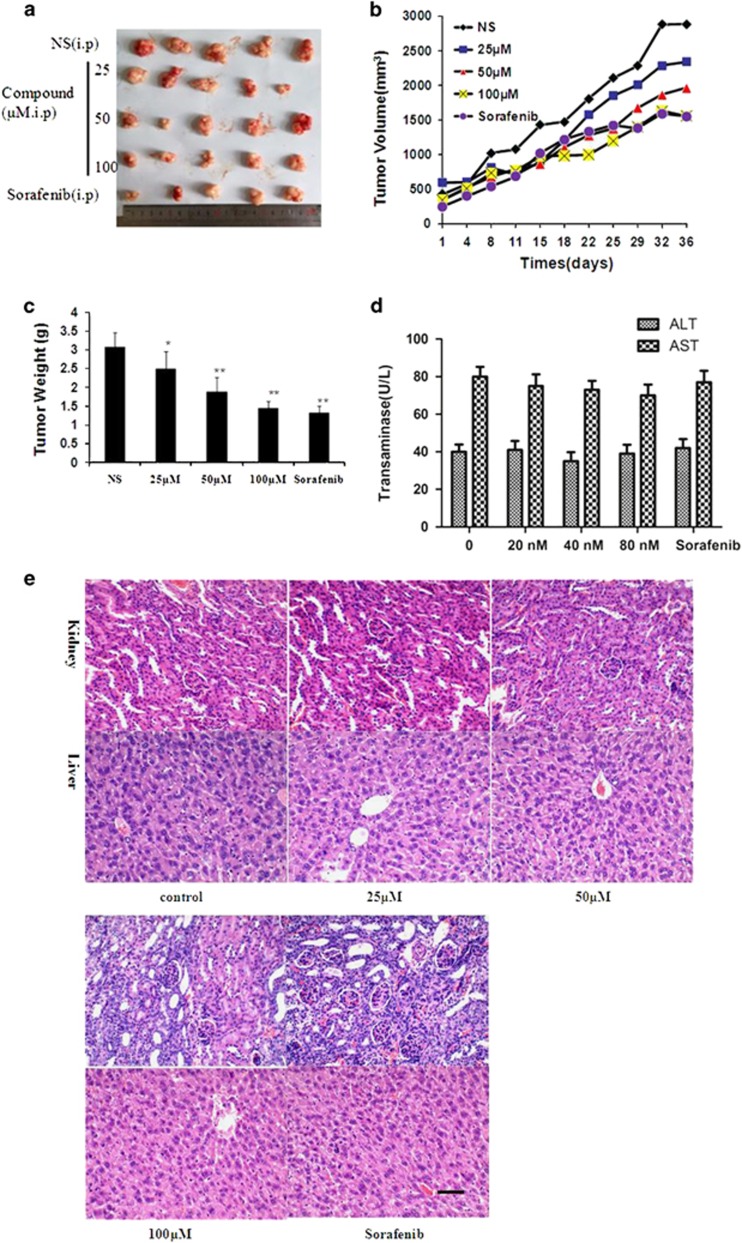
Title compound significantly delays SMMC-7721 tumor growth. (a) Representative tumors from each treatment group. (b) Tumor volume of the mice. (c) Tumor weights after the title compound and sorafenib treatment. (d) In vivo hepatotoxicity evaluation of compound in nude mice. The AST and ALT were determined with Assay Kit. The blood serum samples were treated according to the manufacturer’s instruction. Moreover, the AST and ALT activities are expressed as U/l. (e) H&E-stained sections of the liver and kidney from the mice after treatment. For the statistics of each panel in this figure, data are expressed as mean ±S.D. (n=3); scale bars are 50 μm; *P<0.05 versus control, **P<0.01 versus control

