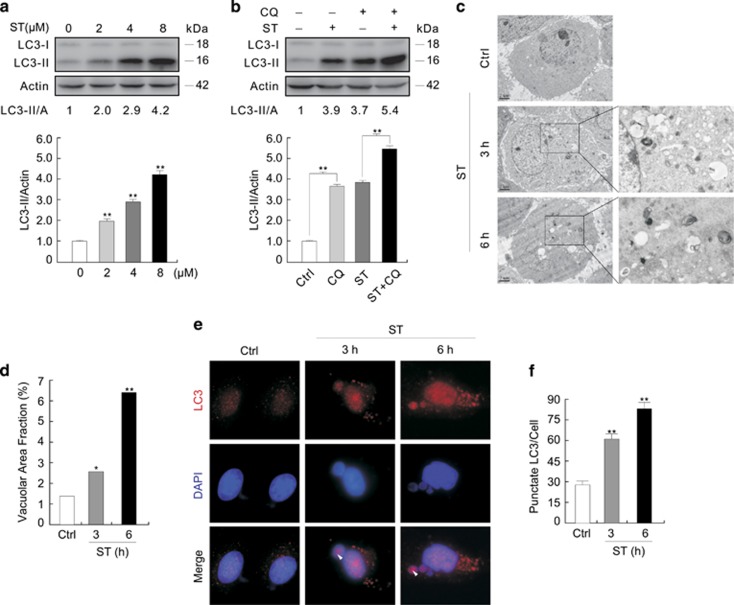
Figure 1.
ST stimulates autophagy in renal cancer cells. (a and b) Following treatment with ST (8 μM; unless otherwise indicated) for 3 h in the presence or absence of 10 μM CQ, 786-O cells were lysed and subjected to immunoblotting with the antibodies indicated. Images from three independent experiments were analyzed by Image J, and mean±S.D. were shown in histograms along with the blots. (c) Electron microscopy was performed for 786-O cells following treatment with ST for 3 and 6 h. The data of the area ratio were non-normally distributed, and presented as the mean of at least 15 cells counted for each group, the data were analyzed by Friedman test (d). (e) Immunofluorescence using the antibody of LC3 was performed for 786-O cells following treatment with ST in the presence or absence of CQ for up to 6 h (arrowheads indicated the LC3 dots in nuclei, and arrows indicated micronuclei). The numbers of the punctate LC3 in each cell were counted, and at least 50 cells were included for each group (f). Data representing the mean±S.D. were shown in graph. *P<0.05 versus control; **P<0.01 versus control. All data were acquired from at least three independent experiments

