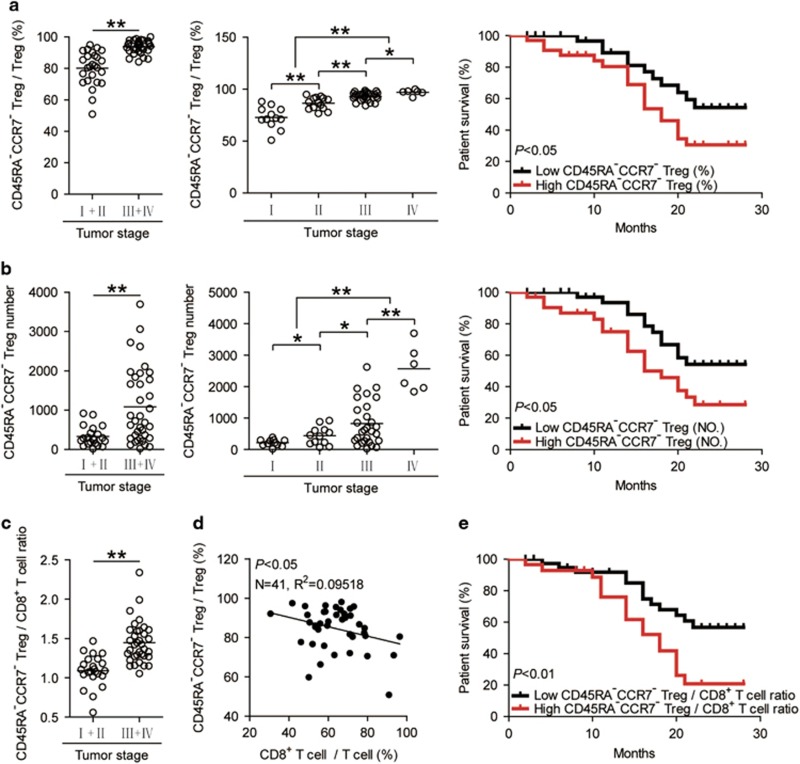
Figure 6.
Increased tumor-infiltrating CD45RA−CCR7− Treg subset correlates with tumor stage and patient poor survival. (a,b) Percentages of CD45RA−CCR7− Treg subset in Tregs (a) and the number of CD45RA−CCR7− Treg subset per million total cells (b) among TNM stage were compared. Kaplan–Meier plots for patient survival by median CD45RA−CCR7− Treg subset percentage (%, 91.3%) (a) or median CD45RA−CCR7− Treg subset number (NO., 457.94 per million) (b). Survival significantly decreased as a function of CD45RA−CCR7− Treg subset percentage⩾91.3% or CD45RA−CCR7− Treg subset number⩾457.94. (c) CD45RA−CCR7− Treg/CD8+ T-cell ratio among TNM stage were compared. (d) The correlations between CD45RA−CCR7− Tregs and CD8+ T cells in gastric tumors were analyzed. Results are expressed as the ratio of the percentages of CD8+ T cells in T cells and the percentages of CD45RA−CCR7− Tregs in Tregs in gastric tumors. (e) Kaplan–Meier plots for patient survival by median CD45RA−CCR7− Treg/CD8+ T-cell ratio (1.289). Survival significantly decreased as a function of CD45RA−CCR7− Treg/CD8+ T-cell ratio ⩾1.289. The horizontal bars and each ring in panels a–c represent mean values and one patient. *, P<0.05; **, P<0.01, and n.s., P>0.05 for groups connected by horizontal lines

