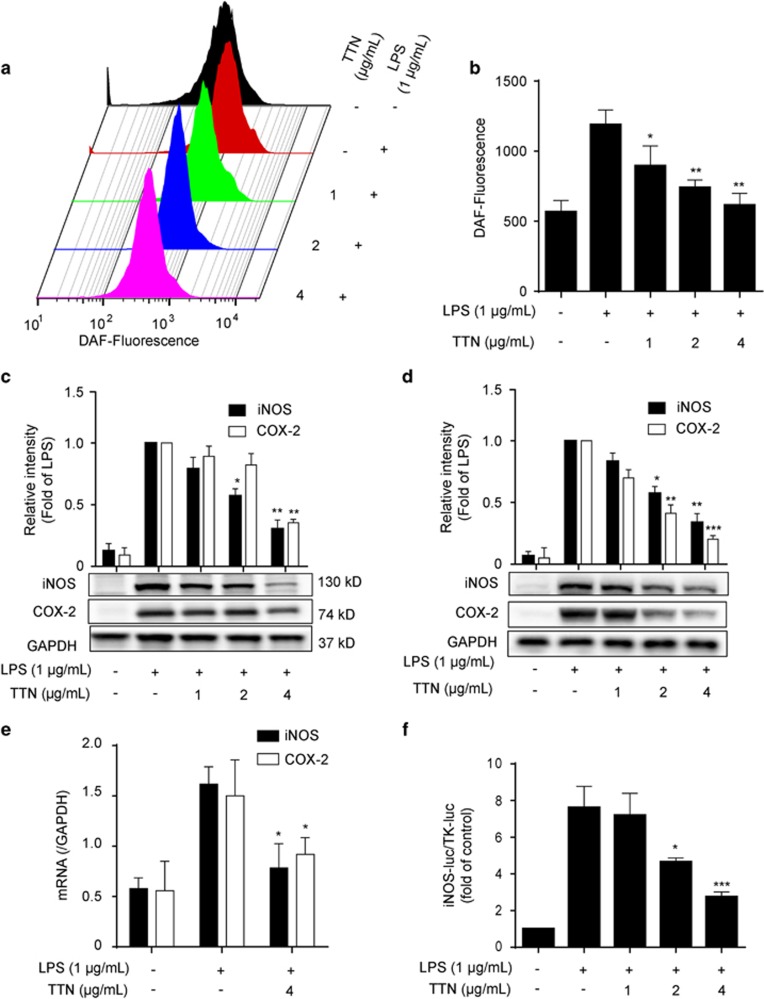
Figure 2.
TTN suppressed lipopolysaccharide (LPS)-induced iNOS and COX-2 expression in RAW264.7 and THP-1 cells. (a and b) RAW264.7 cells were pretreated with TTN for 1 h before LPS (1 μg/ml) stimulation for another 6 h. NO was determined by flow cytometry with DAF-FM (1 μM) (n=6). (c and d) RAW264.7 and THP-1 cells pretreated with the indicated concentrations of TTN for 1 h before LPS (1 μg/ml) stimulation for another 24 h. The expression levels of iNOS and COX-2 were examined by western blotting analysis (n=6). (e) RAW264.7 cells were pretreated with TTN (1–4 μg/ml) for 1 h before LPS stimulation for another 6 h. The mRNA levels of iNOS and COX-2 were determined by qRT-PCR assay (n=6). (f) RAW264.7 cells were transiently co-transfected with iNOS-luc and TK-luc for 48 h. Cells were pretreated with TTN (4 μg/ml) before LPS (1 μg/ml) stimulation for another 24 h. Luciferase activity was determined by Dual-Glo Luciferase Assay (n=6). The values were expressed as means±S.D. *P<0.05, **P<0.01, and ***P<0.001 versus LPS alone group

