Figure 5.
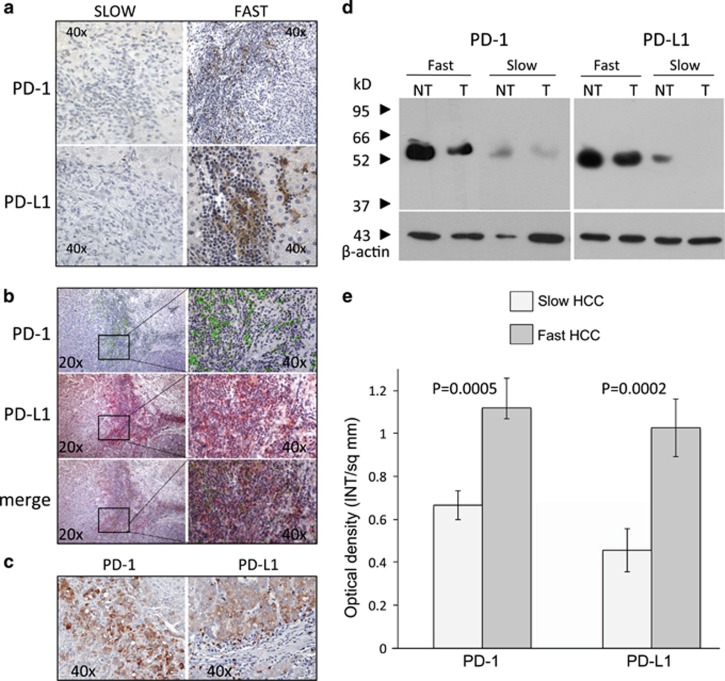
(a) Immunohistochemical demonstration of PD-1 and PD-L1 in slow and fast HCCs. Fast HCCs display strong positivity, localized in the lymphocytic infiltrate. (b) PD-1- and PD-L1-positive cells co-localize in the areas of stronger lymphocytic infiltrate. (c) In fast HCC, both PD-1 and PD-L1 can be demonstrated in hepatocytes. (d) Western blot analysis confirms the higher level of positivity of fast HCCs in comparison with slow HCCs, which are weakly positive or negative in the tumor. (e) Semi-quantification of PD-1 and PD-L1 in tumor tissue of fast and slow HCCs. Columns represent mean of optical density, normalized to β-actin, of 20 patients (14 with slow tumors and six with fast tumors) (error bars: S.D.). PD-1 and PD-L1 levels were significantly different between slow and fast HCCs (P=0.0005 and P=0.0002, respectively)

