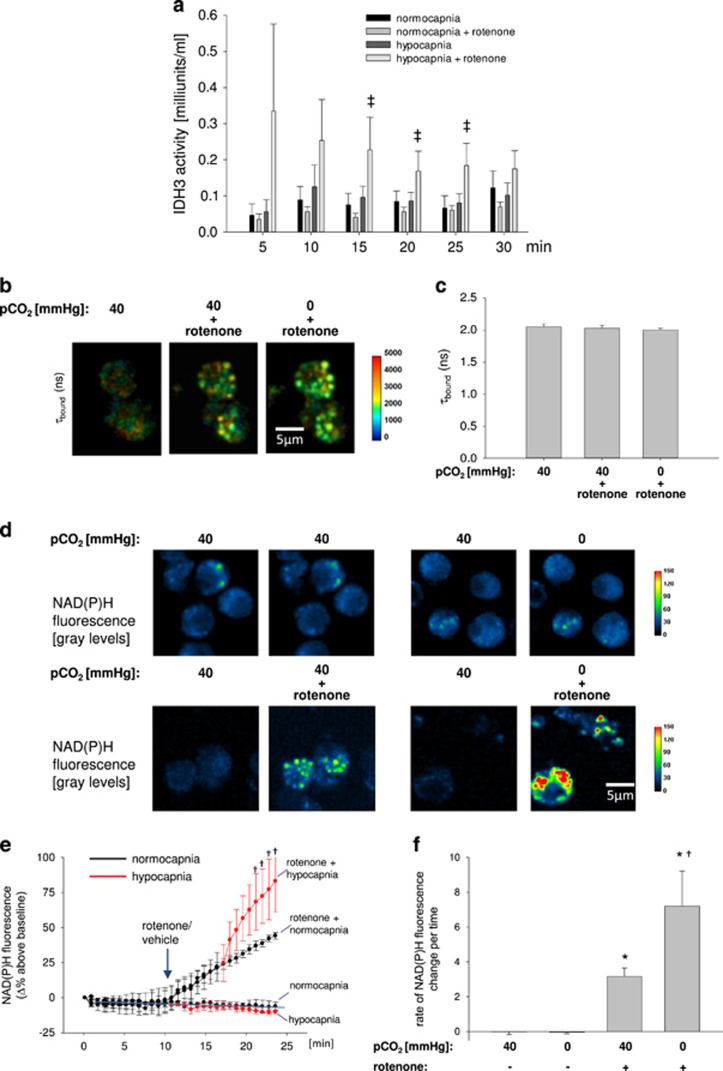
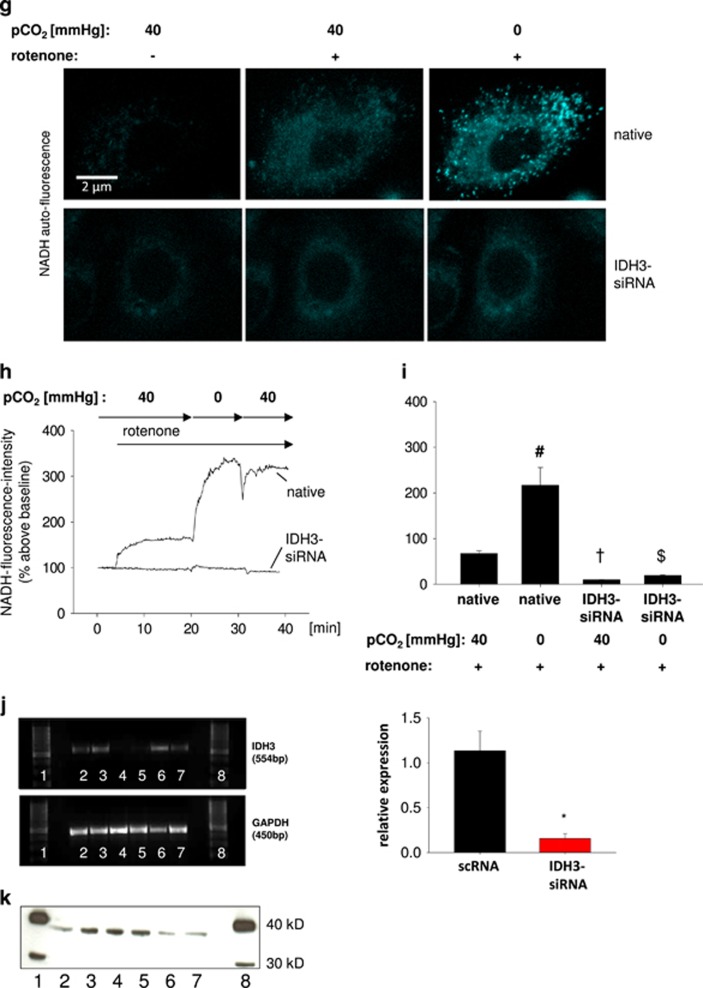
Figure 1.
IDH3 activity and NADH concentration in AEC type 2. (a) Group data of IDH3 activity in primary isolated AEC type 2 measured every 5 min under normocapnic (pCO2: 40 mm Hg) or hypocapnic (pCO2: 0 mm Hg) conditions without or with rotenone (1 μM), respectively, at constant extracellular pH of 7.4. 50 000 cells/well. Mean±S.E., ‡P<0.05 versus pCO2: 0 mm Hg (hypocapnia) alone. Each measurement of a single experiment was repeated twice. In total, 2–10 cells were analyzed per picture. Each experiment was repeated six times. (b) Color-coded images and (c) quantification of changes in τbound in primary isolated AEC type 2 under normocapnic (pCO2: 40 mm Hg) conditions alone or in combination with rotenone or after hypocapnia (pCO2: 0 mm Hg) in combination with rotenone. Mean±S.E., repeated four times. (d) Images of primary isolated AEC type 2 show the pseudocolor-coded NAD(P)H. Upper panel, left group: left picture – normocapnic condition (baseline), right picture – normocapnic condition (control intervention); upper panel, right group: left picture – normocapnic condition (baseline), right picture – hypocapnic condition alone (intervention); lower panel, left group: left picture – normocapnic condition (baseline), right picture – normocapnic condition+rotenonre (intervention); lower panel, right group: left picture – normocapnic condition (baseline), right picture – hypocapnic condition+rotenone (intervention). pH was constant at 7.4. A total of 2–10 cells were analyzed per picture. Experiments were repeated four times. (e) Δ percentage change of the NAD(P)H fluorescence in primary isolated AEC type 2 under normocapnic baseline conditions, after rotenone (1 μM) or vehicle application, and again under normo- or hypocapnic conditions, as indicated. Black line represents normocapnic condition, red line represents hypocapnic condition. Experiments were conducted at constant pH of 7.4 throughout. Mean±S.E., †P<0.05 versus rotenone at pCO2 of 40 mm Hg (normocapnia). In total, 2–10 cells were analyzed per image. Experiments were repeated four times. (f) Rate of NAD(P)H fluorescence change during baseline conditions, hypocapnia alone, normocapnia in combination with rotenone or hypocapnia in combination with rotenone at constant pH of 7.4, as indicated. Mean±S.E., *P<0.05 versus pCO2 of 40 mm Hg alone (control), †P<0.05 versus rotenone at pCO2 of 40 mm Hg (normocapnia). In total, 3–10 cells were analyzed per image. Experiments were repeated four times. (g) Images showing NADH auto-fluorescence (measured at ex.: 360 nm and em: 510 nm) of native or IDH3-siRNA-treated A549 cells superfused with normocapnic (pCO2: 40 mm Hg) or hypocapnic (pCO2: 0 mm Hg) buffer without or with rotenone, as indicated. (h) Tracing of the percentage change of the NADH auto-fluorescence in native or IDH3-siRNA-treated A549 cells superfused with normo- or hypocapnic buffer, as indicated, at constant pH of 7.4. Rotenone (1 μM) was applicated as indicated. (i) Group data of maximal NADH auto-fluorescence response 10 min following rotenone (1 μM) under normocapnic conditions or 10 min following additionally switching to hypocapnic conditions in native or IDH3-siRNA-treated A549 cells in comparison with normocapnic baseline conditions. Experiments were performed at constant extracellular pH of 7.4. Mean±S.E., #P<0.05 versus baseline (pCO2: 40 mm Hg). †P<0.05 versus rotenone at pCO2 of 40 mm Hg in native cells, $P<0.05 versus rotenone at pCO2 of 0 mm Hg in native cells. In total, 4–11 cells were analyzed per picture. Experiments were repeated six times. (j) (Left) Gels show RT-PCR products for IDH3- and GAPDH-mRNA in native (lane 2 and 3), in IDH3-siRNA- (lane 4 and 5), and scRNA-treated (lane 6 and 7) A549 cells. Lane 1 and 8: molecular weight ladder. (Right) Group data of relative IDH3-mRNA expression, *P<0.05 versus scRNA (control), n=4–5 each. (k) Western blot show IDH3 protein in native (lane 2 and 3), in scRNA- (lane 4 and 5), and IDH3-siRNA-treated (lane 6 and 7) A549 cells. Lane 1 and 8: molecular weight ladder


