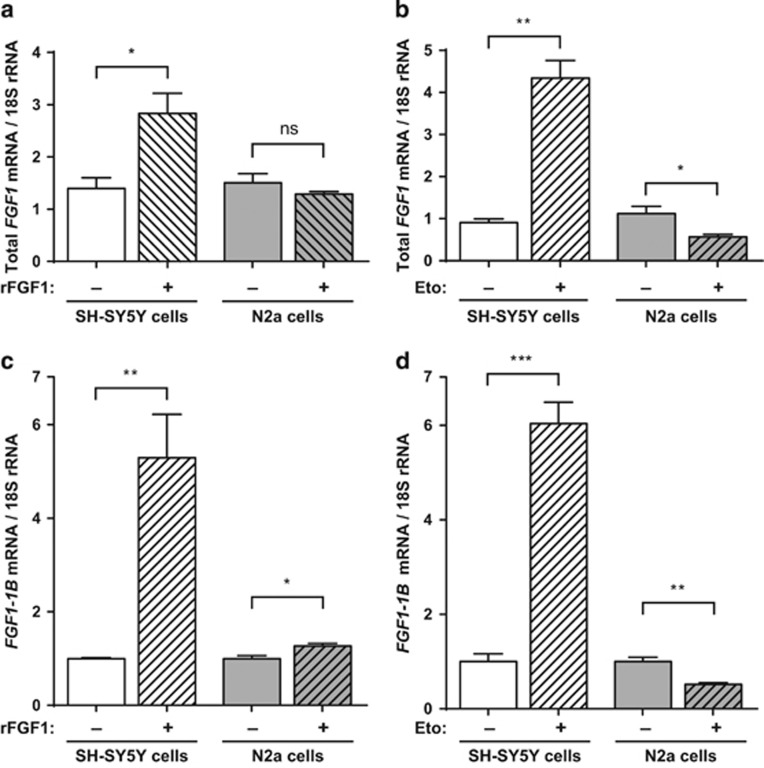
Figure 3.
Extracellular FGF1 and etoposide increase endogenous fgf1 expression in SH-SY5Y cells, in contrast to N2a cells. SH-SY5Y and N2a cells were treated or not with rFGF1 for 72 h (a–c) or etoposide for 16 h (b–d). The levels of all fgf1 mRNAs (a,b) or of the alternative 1B fgf1 mRNA (c,d) were analyzed by RT-PCR. The 18S rRNA levels were used as a control for quantifications. The graphs represent the mean ±S.E.M. of three independent experiments. Student’s t-tests were performed (n=3; n.s.: P>0.05; *P⩽0.05; **P⩽0.01; ***P⩽0.001)

