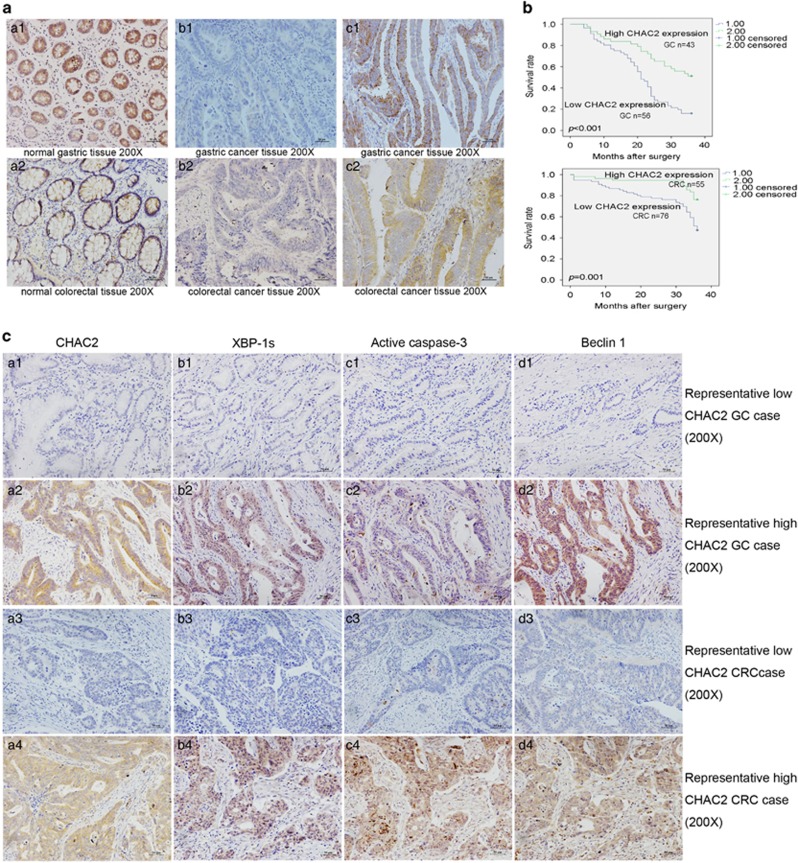
Figure 2.
The immunohistochemical results of CHAC2 expression and Kaplan-Meier survival curves. (a) Representative immunohistochemical staining for CHAC2 which is mainly expressed in cytoplasm of cells. Original magnification: × 200. (b) The overall Kaplan-Meier plots according to CHAC2 expression in patients with gastric and colorectal cancers, which showed a poorer survival in CHAC2-low expression patients than that in CHAC2-high expression patients. The HR for gastric and colorectal cancers were 0.363 (95% CI 0.194–0.678, P=0.002) and 0.383 (95% CI 0.227–0.645, P<0.001), respectively. (c) Representative immunohistochemical staining results showing the positive correlationship between CHAC2 expression and XBP-1s, active caspase-3, or Beclin 1. a1, b1, c1 and d1 is a low CHAC2 expression GC case; a2, b2, c2 and d2 is a high CHAC2 expression GC case; a3, b3, c3 and d3 is a low CHAC2 expression CRC case; a4, b4, c4 and d4 is a high CHAC2 expression CRC case; GC gastric cancer; CRC colorectal cancer. Original magnification: × 200. All the relative quantitive values were put below the correspondent blots

