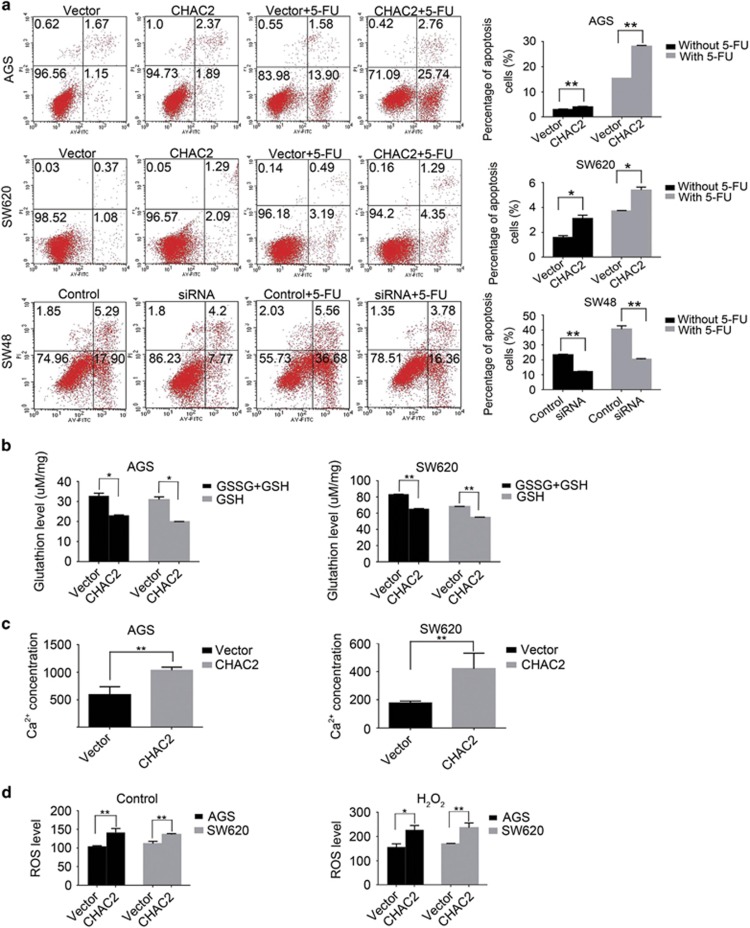
Figure 4.
Effect of CHAC2 on apoptosis and production of T-GSH, GSH, Ca2+, and ROS of cancer cells. (a) Representative results of annexin V-FITC/PI staining and quantitative analysis in CHAC2 overexpression or knockdown cells. Values are mean±s.d of three independent experiments. Asterisk indicates statistically significant difference (**P<0.01, *P<0.05). (b) The T-GSH (GSSG+GSH) and GSH concentration of CHAC2-transfected cells comparing with that of controls. (c) Effect of CHAC2 on cytoplasmic Ca2+ concentration of cancer cells. (d) Analysis of ROS production in CHAC2-transfected cells. All the above experiments were performed in triplicate, using vector-transfected cells as control. The data were presented as mean±s.d. Asterisk indicates statistically significant difference (**P<0.01, *P<0.05)

