Figure 1.
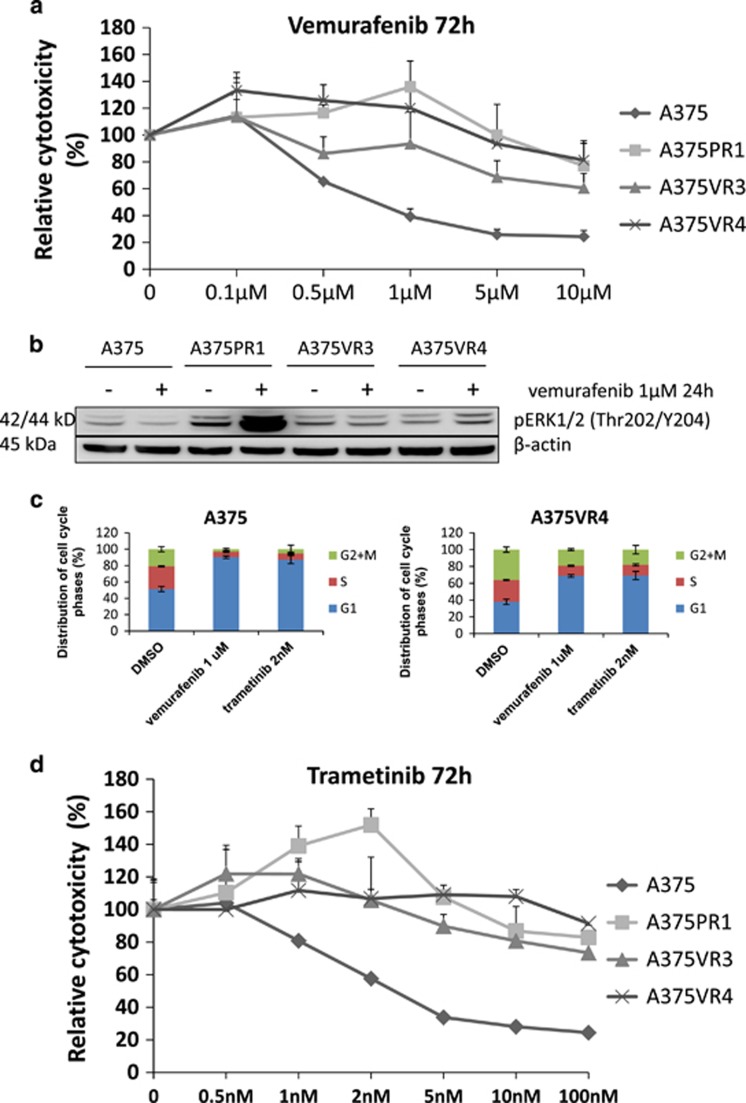
Melanoma cells with cross resistance to BRAFi vemurafenib and the MEKi trametinib show MAPK pathway reactivation and less G1 cell cycle arrest after vemurafenib and trametinib treatment. (a) Dose–response curves after 72 h exposure to vemurafenib in parental A375 and three BRAFi-resistant sublines, showing cytoxic effect as % of DMSO control. (Error bars represent S.D. of the mean of three independent MTS experiments). Parental A375 cells had an IC50 of <1 μM for vemurafenib, evaluated by MTS colorimetric assay. In contrast, IC50 was not reached in the resistant sublines by treatment with vemurafenib with concentrations up to 10 μM. A low concentration of BRAFi, 1 μM for A375PR1 and 0.1 μM for A375VR4, significantly induced proliferation (P<0.05). (b) Protein expression levels of pERK analyzed by immunoblotting after 24 h exposure to 1 μM of vemurafenib (or DMSO as control treatment) demonstrated reactivation of the MAPK pathway in the resistant cell lines. (c) The cell cycle distribution effect in parental A375 and A375VR4 after 24 h treatment with 1 μM vemurafenib or 2 nM trametinib (Error bars represent S.D. of the mean of 3–6 replicates). (d) Dose–response curves after 72 h exposure to trametinib in parental A375 and three resistant sublines. (Error bars represent S.D. of the mean of three independent MTS experiments). In addition, a significant induction of proliferation of A375PR1 was also observed after treatment with 2 nM trametinib (P<0.05)

