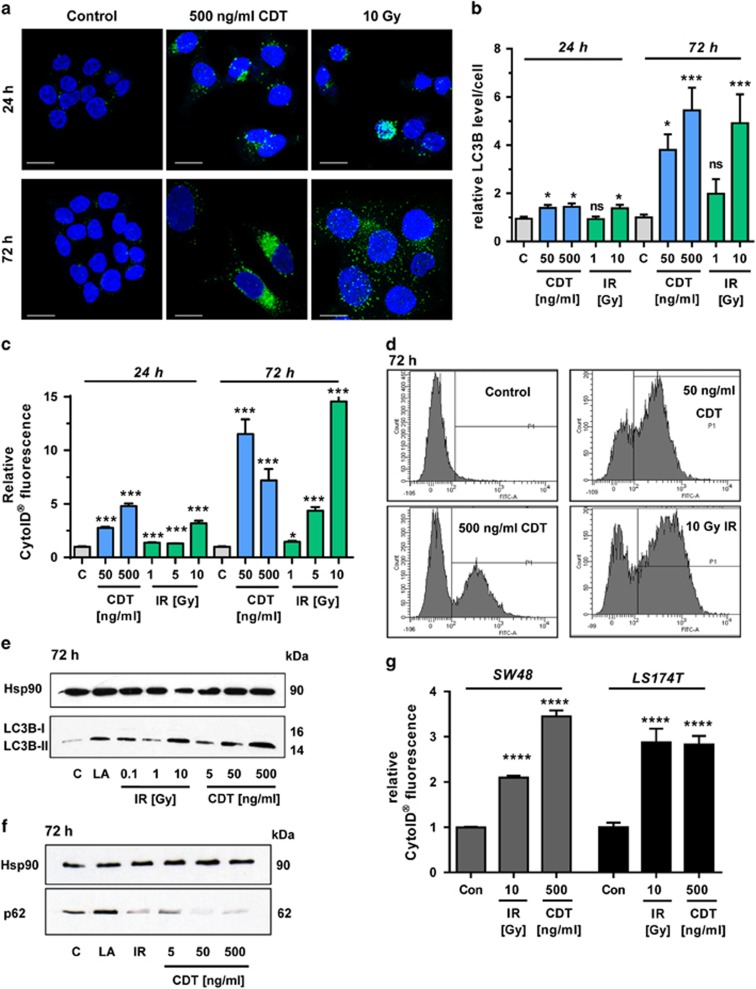
Figure 1.
Time- and dose-dependent induction of autophagy following DNA DSBs. (a and b) Time- and dose-dependent induction of the autophagy marker LC3B. HCT116 cells were treated with CDT or exposed to γ-irradiation and incubated for up to 72 h. Cells were then fixed and stained for LC3B (green). Nuclei were visualized by TO-PRO-3 (blue). Images were recorded by confocal microscopy and LC3B intensity was quantified by ImageJ (n=3, 8–10 sections per sample). ***P<0.001, *P<0.05, NS: not significant, versus untreated controls. Scale bar represents 20 μm. (c) Time- and dose-dependent induction of autophagosomes. HCT116 cells were treated as described above and harvested after 24 or 72 h. Autophagic vesicles were stained with the CytoID Autophagy Detection Kit and measured by flow cytometry. n=3; NS: not significant; ***P<0.001, *P<0.05, versus control cells. (d) Representative histograms of CytoID staining. (e and f) Impact of CDT and IR on LC3B-II and p62 levels after 72 h. Cells were treated with CDT or IR in a dose-dependent manner and harvested after 72 h. Samples were analyzed by SDS-PAGE and western blotting as indicated. Hsp90 was visualized as loading control. LA was used as positive control. (g) Determination of autophagosomes in SW48 and LS174T cells upon DSB induction. Cells were treated as indicated and harvested after 24 h. Autophagic vesicles were stained with the CytoID Autophagy Detection Kit and measured by flow cytometry. n=3; ****P<0.0001, versus control cells

