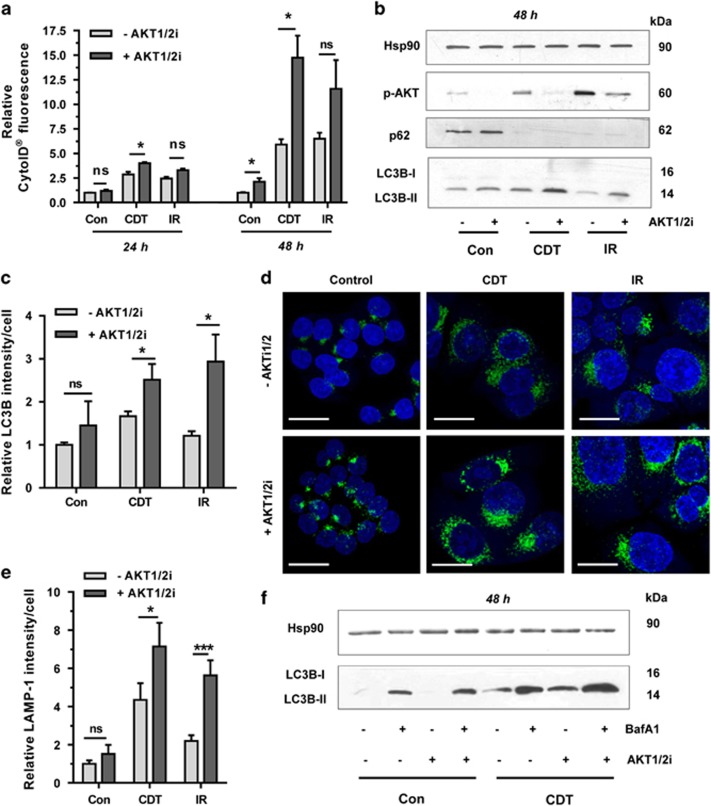
Figure 5.
DSB-mediated AKT activation restrains concomitant autophagy induction. (a) Impact of AKT on DSB-induced autophagosome formation. HCT116 cells were treated with CDT (500 ng/ml) or irradiated (10 Gy) in the absence or presence of an AKT1- and AKT2-specific inhibitor (AKT1/2i; 1 μM). Cells were harvested after 24 or 48 h and then processed for CytoID staining followed by flow cytometry (n=3). NS: not significant. *P<0.05. (b) Effect of AKT on DSB-induced LC3B accumulation and p62 degradation. Cells were treated as described above and analyzed by western blotting detection. Hsp90 served as loading control. (c) Impact of AKT on DSB-induced LC3B-positive vesicles. Cells were incubated for 48 h as mentioned above and LC3B-positive vesicles were determined by confocal immunofluorescence microscopy. (n=3) NS: not significant. *P<0.05. (d) LAMP-1 staining following DSB induction in the absence or presence of AKT signaling. Cells were incubated for 48 h as described, processed for LAMP-1 staining and analyzed by confocal microscopy. Representative images are shown. LAMP-1 is depicted in green and nuclei are shown in blue. Scale bar: 20 μm. (e) Quantitative evaluation of LAMP-1 staining as shown in panel (e). LAMP-1 intensity was quantified by ImageJ (n⩾3, 8–10 sections per sample). ***P<0.001, *P<0.05, NS: not significant. (f) Impact of AKT inhibition on autophagic flux. HCT116 cells were incubated with CDT in the absence or presence of an AKT1- and AKT2-specific inhibitor (AKT1/2i; 1 μM) for 45 h, then supplemented or not with the autophagy inhibitor Baf A1 (10 nM) and incubated for another 3 h. After 48 h, cells were harvested and subjected to SDS-PAGE followed by western blotting detection of LC3B. Hsp90 served as loading control

