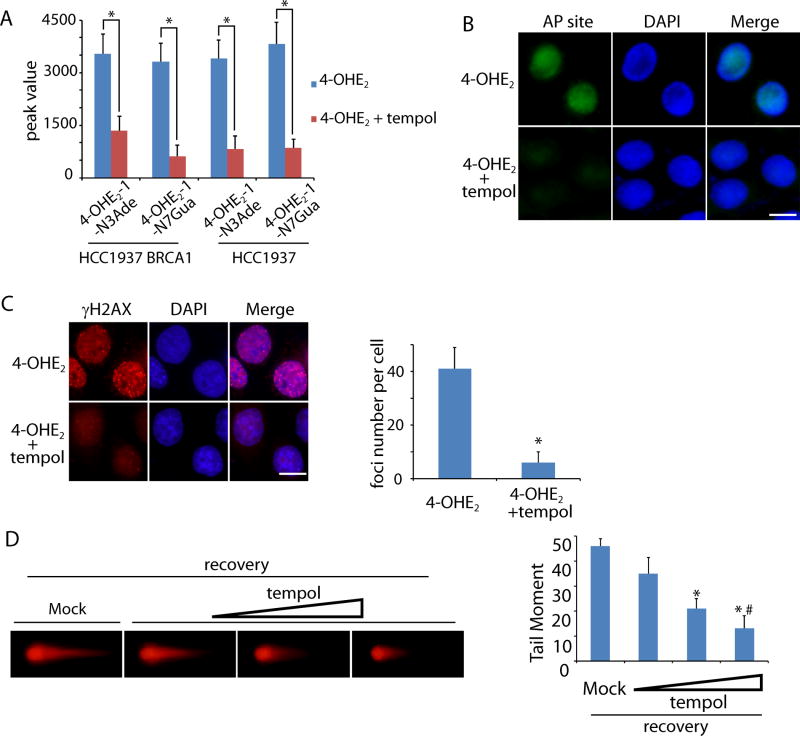
Figure 4. Tempol treatment suppresses 4-OHE2-induced DNA lesions in vitro.
(A) Tempol treatment suppresses 4-OHE2-1-N3Ade and 4-OHE2-1-N7Gua. HCC1937 BRCA1 and HCC1937 cells were preincubated with mock or tempol followed by the treatment of 4-OHE2. The levels of 4-OHE2-1-N3Ade and 4-OHE2-1-N7Gua were examined by mass spectrometry. (B) AP sites are remarkably reduced in the presence of tempol. HCC1937 cells were preincubated with or without tempol followed by the treatment of 4-OHE2. (C, D) Tempol treatment suppresses 4-OHE2-induced DSBs. (C) Foci of γH2AX in HCC1937 cells were examined. Scale bars: 10 µm. Foci numbers of γH2AX in each cell are shown in the graph. (D) HCC1937 cells were preincubated with mock or tempol (20, 50, and 100 µM). Neutral comet assays were performed to examine 4-OHE2-induced DSBs. Tail moments of the cells treated with different doses of tempol are shown in the histogram. * and #, p < 0.01, respectively.

