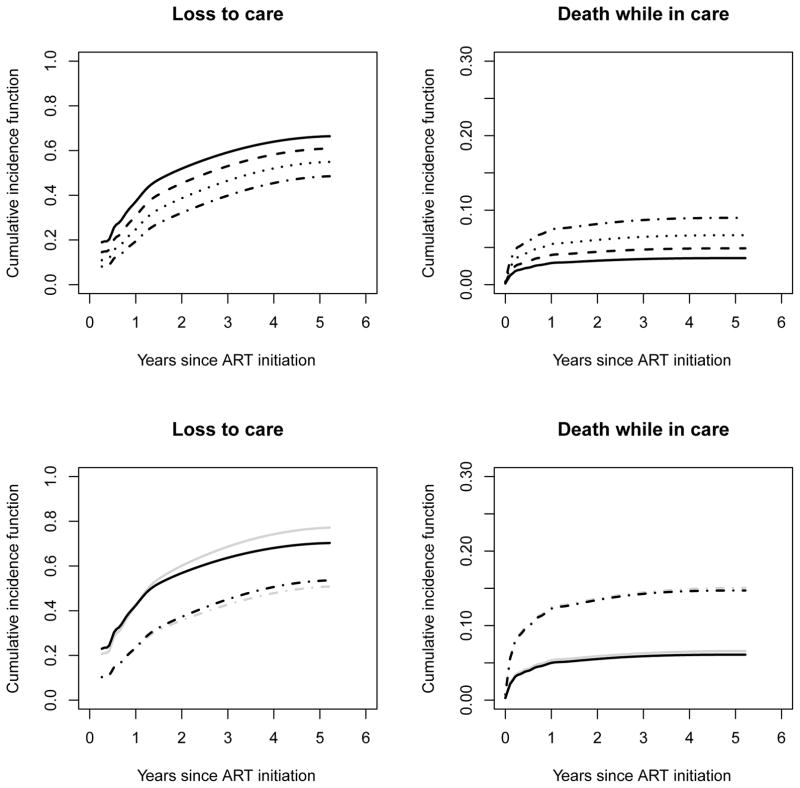
Figure 3.
Estimated cumulative incidence of loss to care (top left panel) and of death (top right panel) for a female patient with a CD4 count of 120 cells/μl at ART initiation, according to age at ART initiation (solid lines = 20 years; dashed lines = 30 years; dotted lines = 40 years; dashed-dotted lines = 50 years) based on the optimal model according to the grid search, with α = (2, 1.2), and estimated cumulative incidence of loss to care (bottom left panel) and of death (bottom right panel) for a male patient with a CD4 count of 120 cells/μl at ART initiation, according to age (solid lines = 20 years; dashed-dotted lines = 50 years), based on the optimal model (black lines) and the Fine-Gray – proportional odds model (gray lines) with α = (0, 1).

