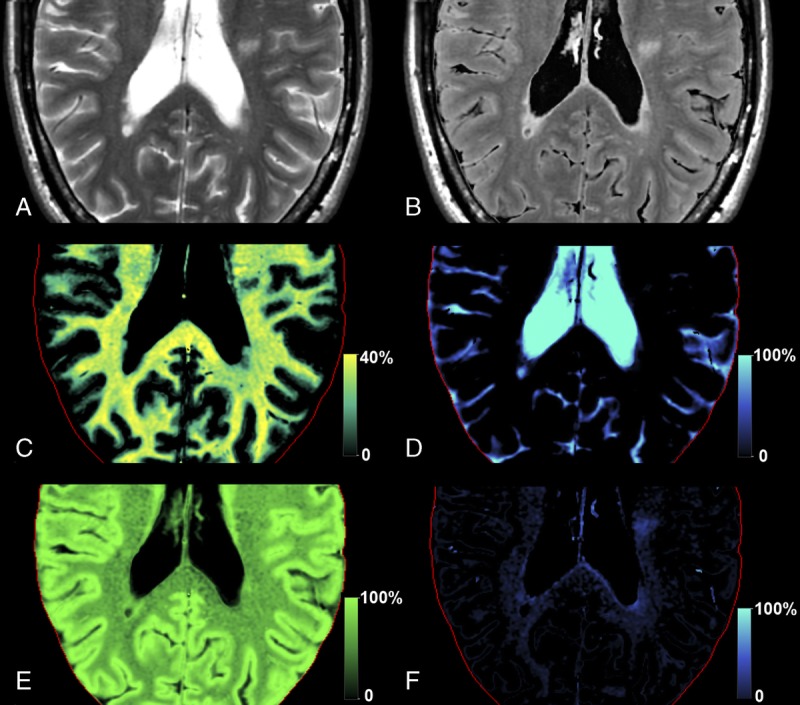
FIGURE 4.

Myelin segmentation in a patient with multiple sclerosis. Synthetic T2-weighted (A) and fluid-attenuated inversion recovery (B) images of an axial slice of the brain of the patient based on measured R1, R2, and PD maps. Using the same data, the tissue is decomposed into the myelin partial volume VMY (C), the free water partial volume VFW (D), the cellular partial volume VCL (E), and the excess parenchymal water partial volume VEPW (F). The red line indicates the intracranial volume.
