Fig. 1.

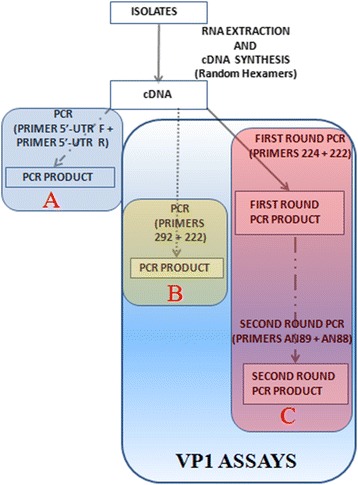
The algorithm used in this study. A depicts the 5′-UTR assay. B and C show the two VP1 assays. While B has only one stage of PCR, C has two consecutive stages (snPCR) of PCR

The algorithm used in this study. A depicts the 5′-UTR assay. B and C show the two VP1 assays. While B has only one stage of PCR, C has two consecutive stages (snPCR) of PCR