Fig. 2.

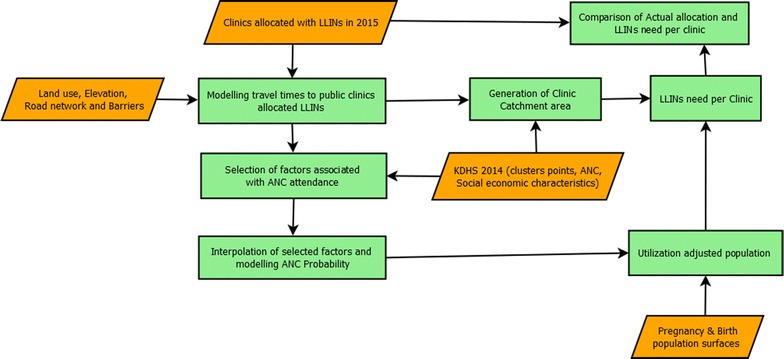
Analytical process used to quantify LLIN need and mis-allocation at each clinic in Western Kenya. The datasets are shown in orange parallelograms while processes are shown in green rectangles

Analytical process used to quantify LLIN need and mis-allocation at each clinic in Western Kenya. The datasets are shown in orange parallelograms while processes are shown in green rectangles