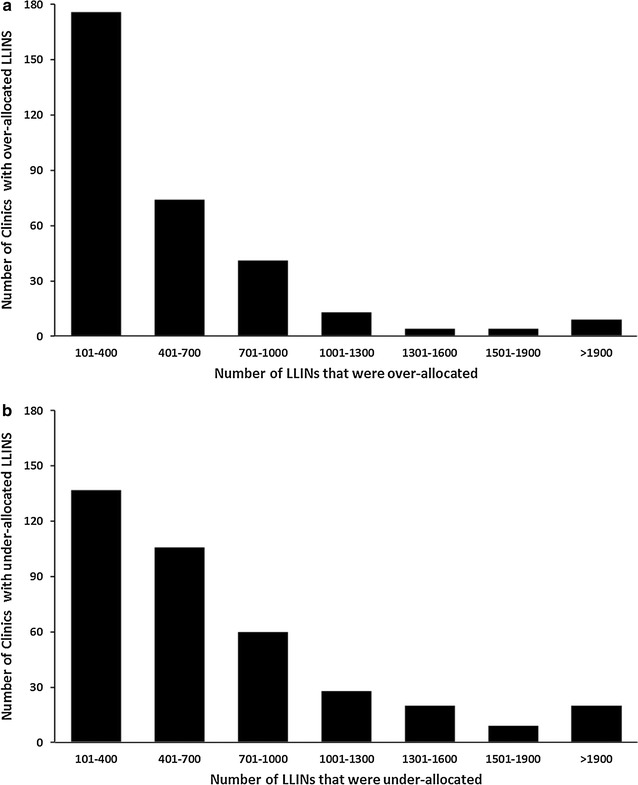
Fig. 5.

Number of clinics (Y axis) against number of LLINs that were over (a) and under-allocated (b) (X axis) in Western region of Kenya in 2015. For example, 176 clinics each had an over-allocation of between 101 and 400 LLINs while 60 clinics had an under-allocation ranging between 701 and 1000 LLINs
