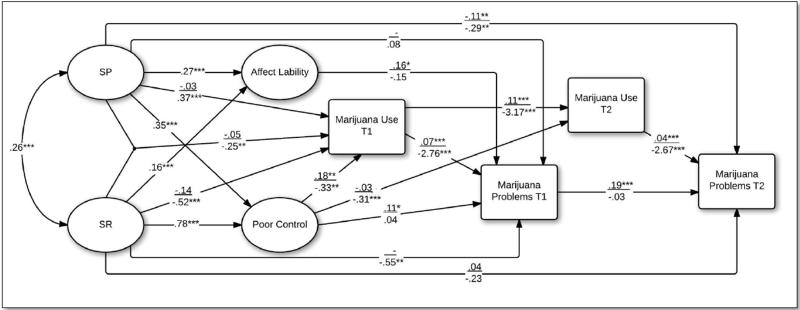
Figure 2.
Final structural model. Note. SP = Sensitivity to punishment; SR = Sensitivity to reward. All values are unstandardized coefficients. N = 2,269 persons. Marijuana use and problems coefficients above the horizontal line represent the count portion and below represent zero-inflation portion (e.g., abstaining). Gender was a covariate to SR, SP, Affect Lability, Poor Control, and Marijuana Use T1, but was omitted for clarity. *p < .05, ** p < .01, ***p < .001

