
Fig. 3.
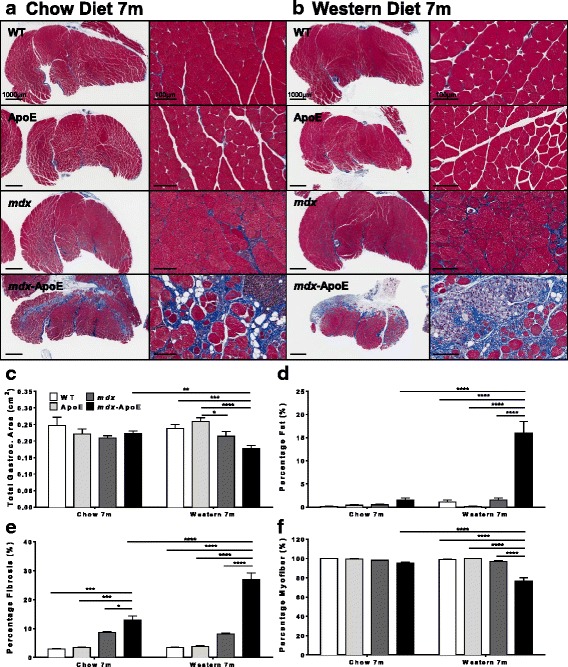
Gastrocnemius muscle size and composition at 7 months on chow and Western diets. Representative images of gastrocnemius from 7-month-old mice stained with Masson’s trichrome, scale bars 1000 μm (left) and 100 μm (right), on chow (a) and on Western diet (b). Quantification of total gastrocnemius area in square centimeter (c) and percentage of area composed of fat (d), fibrosis (e), and healthy myofiber (f). Chow: WT (n = 3), ApoE (n = 4), mdx (n = 10); mdx-ApoE (n = 13). Western: WT (n = 9), ApoE (n = 8), mdx (n = 7), and mdx-ApoE (n = 10). Mean + SEM. *P < 0.05 **P < 0.01 ***P < 0.001 ****P < 0.0001