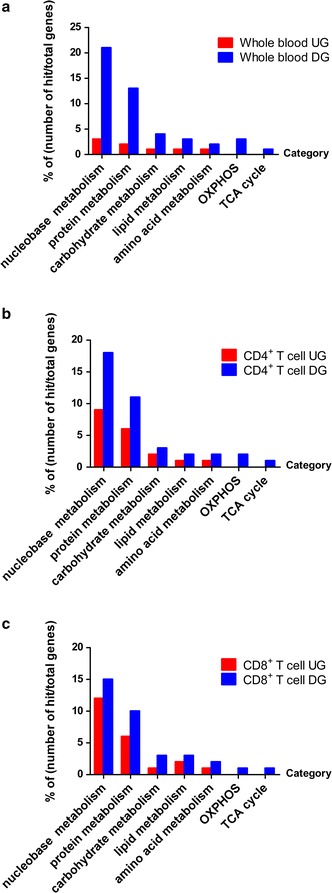
Fig. 4.

GO classification of DEGs specific to whole blood (a), CD4+ (b) and CD8+ T cells (c). A total of 1160 whole blood-specific, 854 CD4+ T cell-specific and 1319 CD8+ T cell-specific DEGs were categorized based on GO slim classification (p < 0.05). A bar represents each gene ontology category. The height of the bar represents the percentage of genes observed in each category. The percentage of genes per category is indicated upon the bars text. UG upregulated genes. DG downregulated genes
