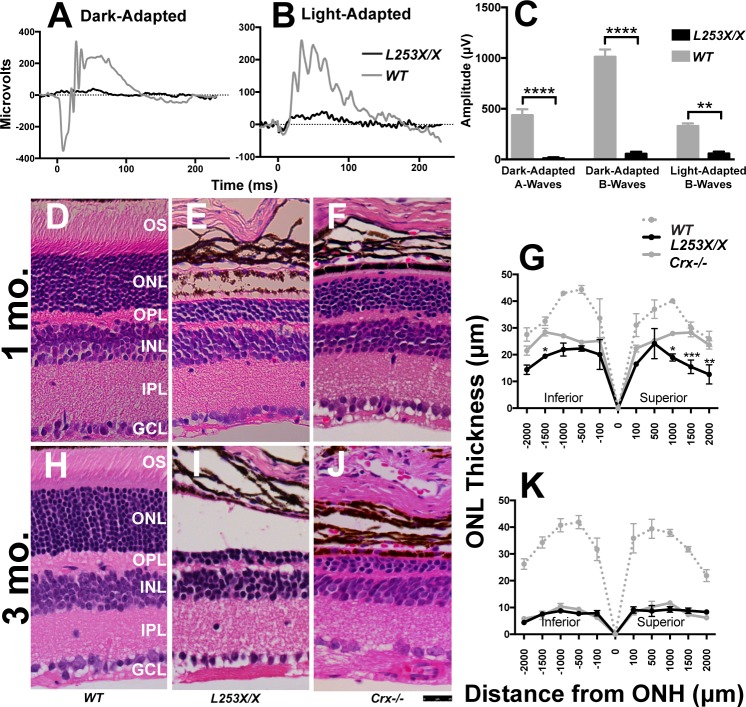
Figure 2.
L253X/X retinas lack rod and cone responses to light and degenerate earlier than Crx−/−. ERG was used to measure rod (dark-adapted) and cone (light-adapted) responses to various light stimuli in 1-mo L253X/X and WT mice. (A, B) Comparison of representative ERG traces at the highest light intensity: 0.89 log scot cd/m2 for dark-adapted responses, and 2.67 log scot cd/m2 for light-adapted responses. (C) Bar graphs compare mean A-wave and/or B-wave amplitude differences between the two genotypes at the highest light intensity tested (mean ± SEM, n ≥ 3; * P ≤ 0.05, *** P ≤ 0.0005, **** P < 0.0001; 2-way ANOVA with Sidak's multiple comparisons test). (D–F, H–J) H&E-stained paraffin-embedded sagittal retinal sections from the indicated mice at 1 and 3 mo. Images were taken approximately 500 μm from the ONH at a ×40 magnification (scale bar: 25 μm). (G, K) Morphometry measures at five set distances (in microns) on either side of the ONH (mean ± SEM, n ≥ 3; * P ≤ 0.05, ** P < 0.01, *** P ≤ 0.0003; 2-way ANOVA with Sidak's multiple comparisons test).

