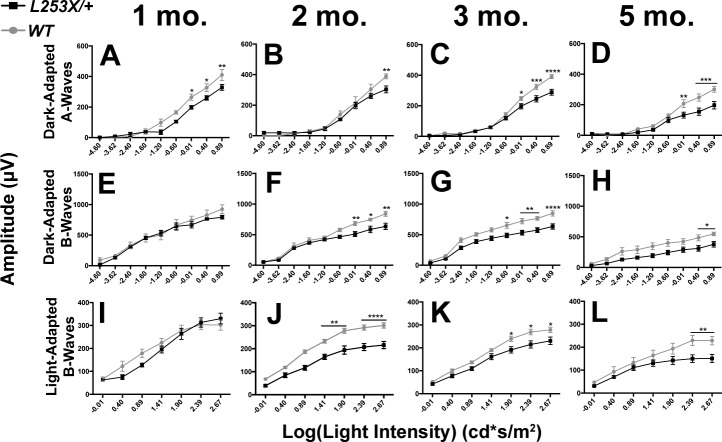
Figure 4.
L253X/+ retinas exhibit reduced rod and cone light responses. ERG responses of L253X/+ mice (black lines) and WT (gray lines) were tested at four adult ages, and dark-adapted and light-adapted A- and B-wave amplitudes quantified: (A, E, I) 1 mo; (B, F, J) 2 mo; (C, G, K) 3 mo; and (D, H, L) 5 mo (mean ± SEM, n ≥ 3; * P < 0.05, **P < 0.01, *** P < 0.0006, **** P < 0.0001; 2-way ANOVA with Sidak's multiple comparisons test).

