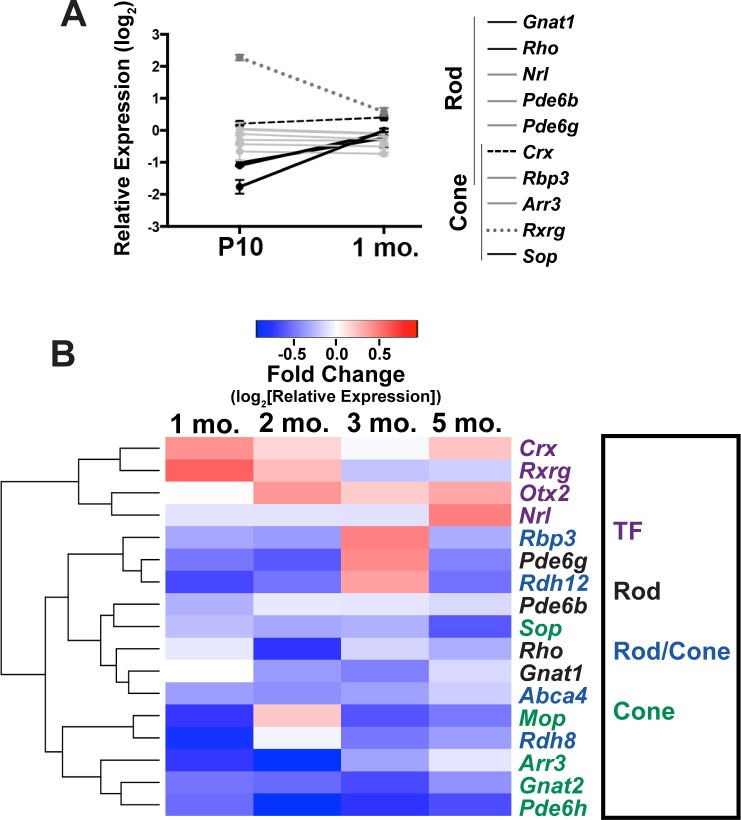
Figure 6.
L253X/+ retinas display dynamic changes in photoreceptor gene expression. qRT-PCR analyses of L253X/+ expression levels (relative to WT mice) of the indicated rod/cone genes are shown at P10 and 1 mo (mean ± SEM, n ≥ 3). Lines connecting expression levels of each gene at the two ages show the dynamic changes in expression, and reveal four different expression trends indicated here by line color and solidity, as described in Results. (B) Heatmap depicting qRT-PCR-detected expression changes of the listed photoreceptor genes in L253X/+ relative to WT at the indicated ages. Data are clustered based on gene expression patterns (log2 [mean fold-change], n ≥ 3). Colored gene names indicate expression in specific photoreceptor subtype(s). TF indicates transcription factors expressed by rods and/or cones that are essential for cell fate specification.

