. 2017 Aug 1;9(31):11327–11337. doi: 10.1039/c7nr04231k

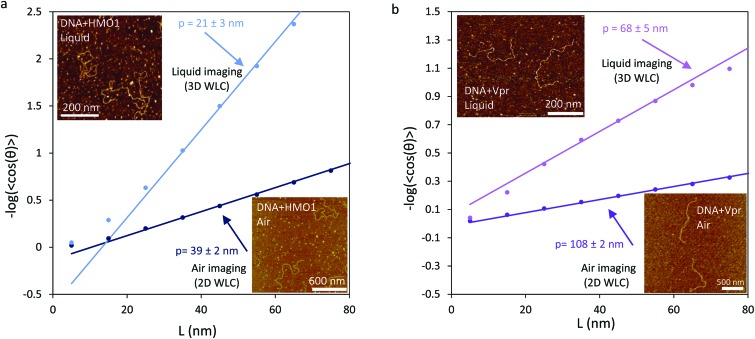
Fig. 2. The yeast nucleolar HMGB protein HMO1 and the HIV-1 Viral protein R decrease and increase the persistence length of the DNA, respectively. (a) The apparent DNA persistence length in DNA-HMO1 complexes (lower-right inset) imaged in air (dark blue) is 39 ± 2 nm when fit to the 2D WLC (eqn (1)). The apparent DNA persistence length in DNA-HMO1 complexes (upper-left inset) imaged in liquid (light blue) is 21 ± 3 nm when fit to the 3D WLC (eqn (2)). (b) The apparent DNA persistence length in DNA-Vpr complexes (lower-right inset) imaged in air (dark purple) is 108 ± 2 nm when fit to the 2D WLC. The apparent DNA persistence length in DNA-Vpr complexes (upper-left inset) imaged in liquid (light purple) is 68 ± 5 nm when fit to the 3D WLC. Uncertainties are 95% confidence intervals from fits to the corresponding WLC model.

Fig. 2