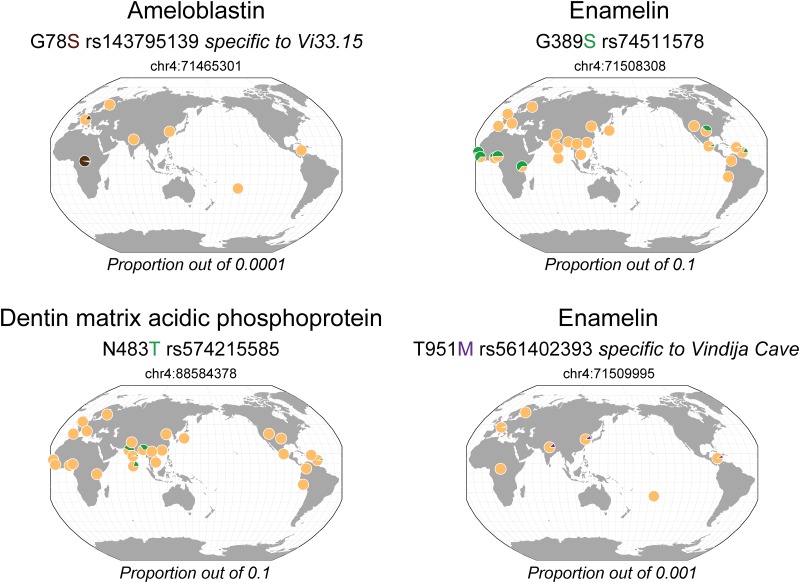
Fig 2. Geographical distribution of the dental protein variants specific to Neanderthals in living people.
The colored amino acid corresponds to the archaic variant. Yellow corresponds to the major allele, green, purple and brown correspond to minor alleles with a proportion out of 0.1, 0.001 and 0.0001, respectively. The maps were generated in the Geography of Genetic Variants Browser (http://popgen.uchicago.edu/ggv/) [50].

