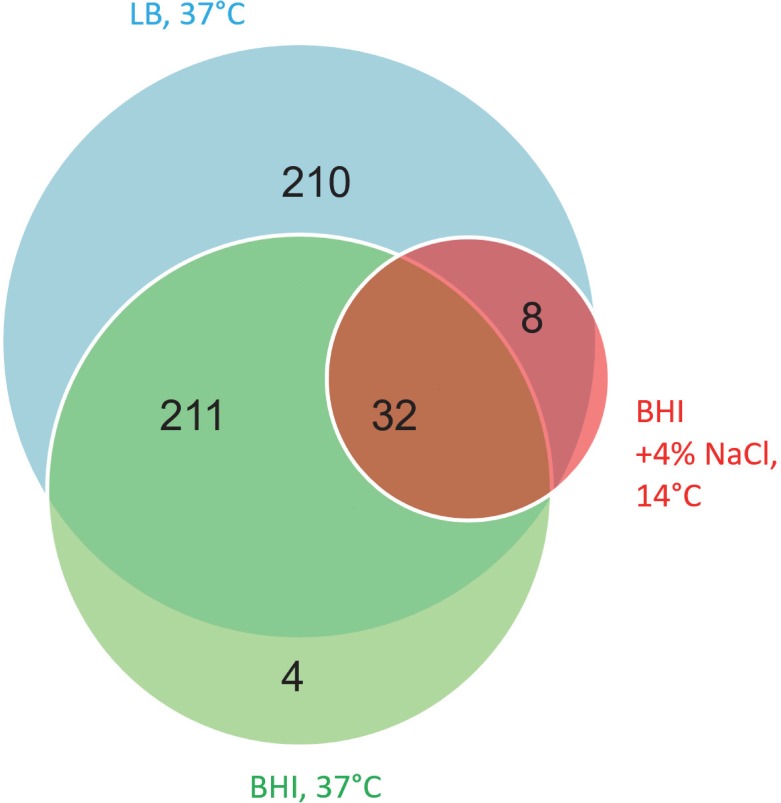
Fig 2. Growth conditions where the novel genes reach or exceed translation thresholds.
The Venn-Diagram shows how many ORFs are translated under the three growth conditions investigated. The majority of novel genes are translated at optimal growth conditions leading to a large overlap between LB and BHI control. Blue: LB at 37°C, green: BHI at 37°C, red: BHI + 4% NaCl at 14°C.

