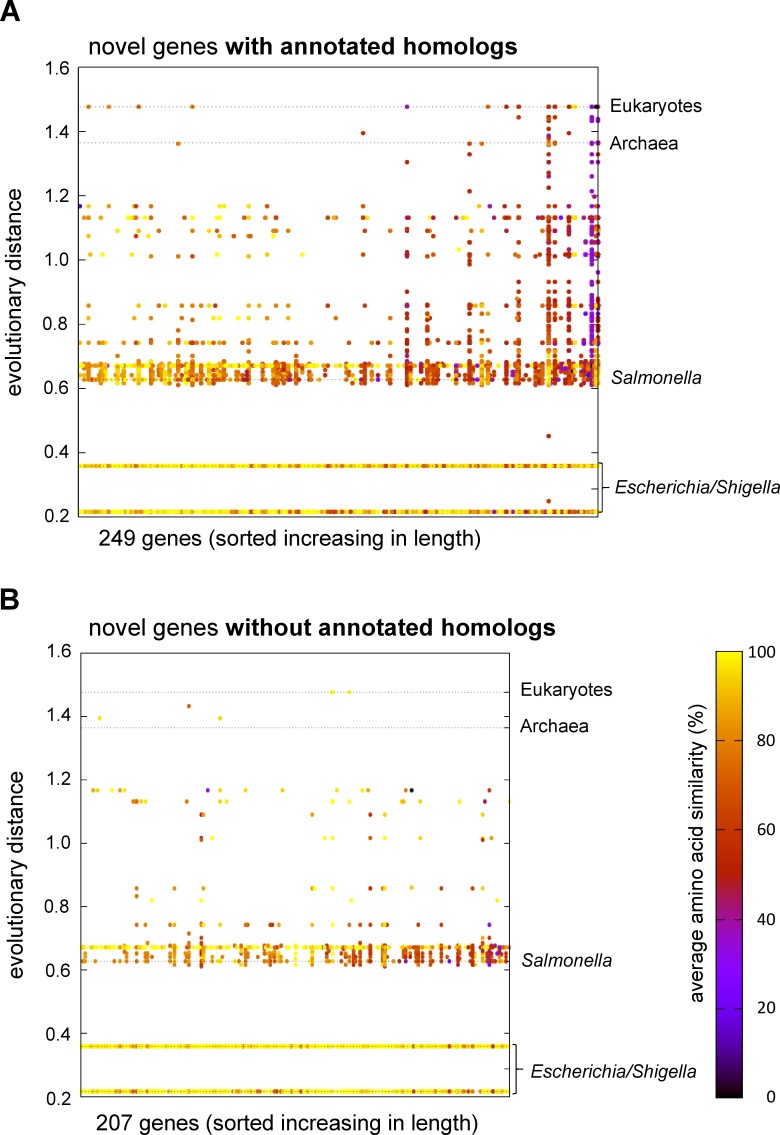
Fig 5. Conservation of novel genes with and without annotated homologs.
Average AA sequence similarity (according to the color scale) for all target sequences from a tblastn search of the RefSeq genomic database, for each ORF is shown. Each dot represents a hit in the database for a given novel gene, with points combined and similarity averaged by genus. Novel genes are spread across the X-axis ordered by their length; the Y-axis shows the taxonomic distance of each genus, using the SILVA database 16S rRNA alignment guide tree. (A) Novel genes with at least one annotated homologous protein sequence. (B) Novel genes without annotated homologs. Those with annotated homologs tend to be found across more genera. Note that the number of homologs found in each genus is not indicated, with the vast majority being in Escherichia and Shigella. Data overview is provided in S5 Table.

