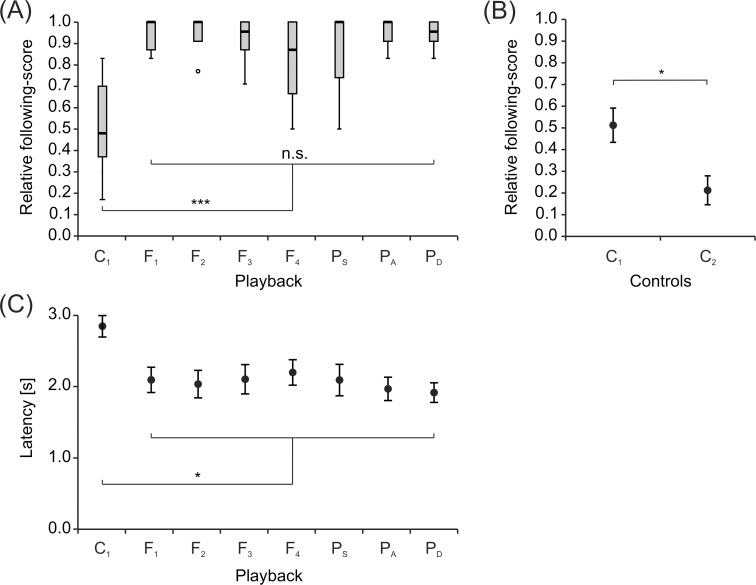
Fig 3. Following-behavior based on playback presentation.
Different playbacks are given on the abscissa. (A) Box plots of relative following-scores for single M. rume following a mobile dummy fish. Animals follow more often during playback presentation compared to the control condition (C1). (B) Comparison of relative following-scores (mean ± s.e.m) between the control conditions. Animals cross the target line more often, if the electrically silent dummy moves across the testing area (C1). (C) Latency (mean ± s.e.m) of fish to enter the testing area after onset of the experiment, i.e. after the dummy fish started moving.

