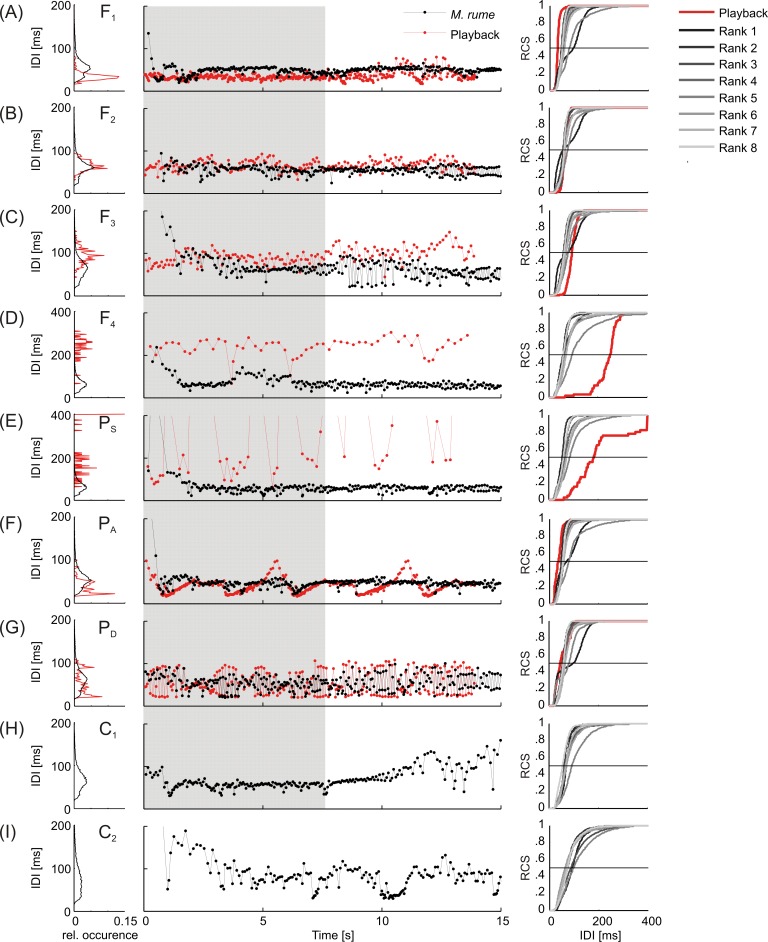
Fig 4. Representation of playback conditions and the electrical responses of M. rume.
Left: Relative IDI-distribution of playbacks (red) and M. rume (black) pooled for all individuals per condition. Middle: Time course of electrical playback IDIs (red) with an exemplary response of fish #2 (black). Right: Relative cumulative sums (RCS) of IDI-distributions of playbacks (red) and M. rume (grey, graded to distinguish between different ranks). Each curve represents data from ten trials that were recorded from an individual fish within the respective condition. The shaded area represents the duration of dummy movement. Note different scaling in D and E.

