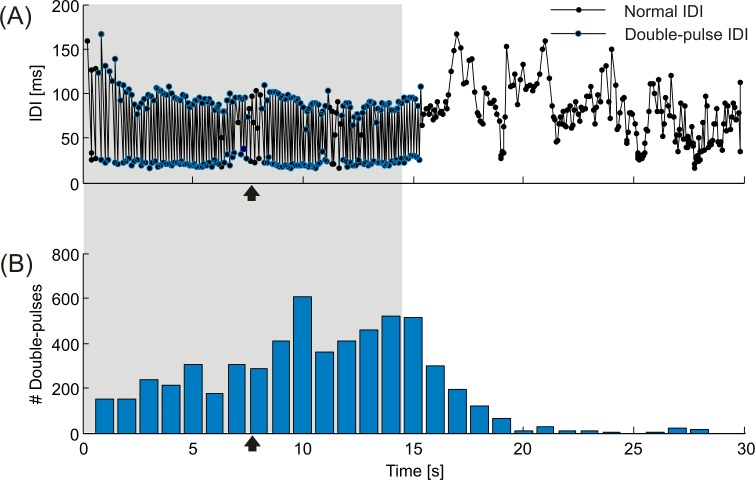
Fig 5. Double-pulse responses over time.
(A) Exemplified electrical response of fish #5 to the double-pulse playback PD (see Fig 4G) with intervals belonging to double-pulse sequences marked by blue circles. (B) The total amount of double-pulse related IDIs is pooled per second for the time course of all experimental trials with playback PD. The shaded area represents the duration of the playback. Dummy fish movement stopped at the time points indicated by black arrows.

