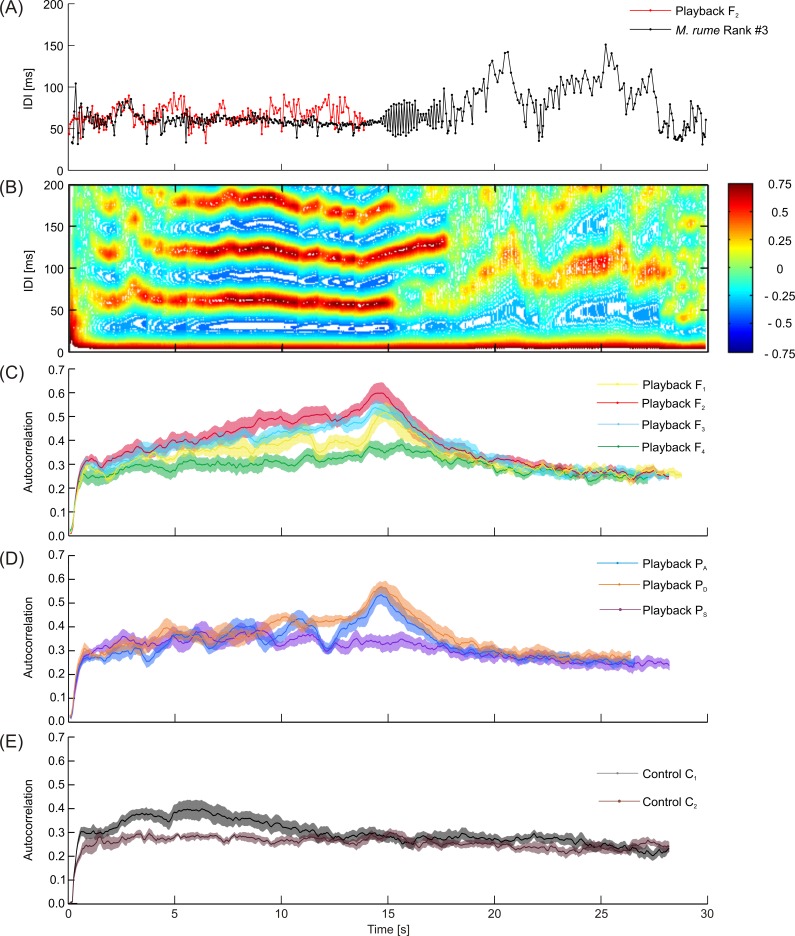
Fig 8. Autocorrelation of electric discharge activity in M. rume.
(A) Exemplary demonstration of a regular discharge pattern with high autocorrelation (compare B) of fish #3 (black) in response to playback F2 (red). Note the typical double-pulse pattern short after stimulus offset. IDIs are longer and more variable in the second half of the recording, when the dummy was silent. (B) Autocorrelation diagram for the sequence shown in (A), with a color coded representation of the correlation between the fish's current discharge activity with its own signal within the previous 200 ms. (C-E) Maximum autocorrelation for all trials averaged for all individuals of M. rume depicted over a time period of 30 seconds. (C) Frequency-based playback trials F1-F4; (D) pattern-based playbacks PA,D,S; (E) controls C1 and C2. Shaded areas represent the standard error of the mean.

