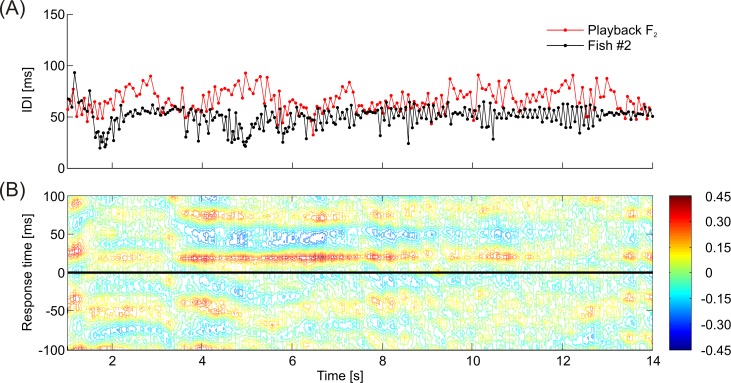
Fig 10. Adaptive cross-correlation analysis between pulse-sequences of playback and M. rume.
(A) IDI-sequences of playback F2 (red) and an exemplary response of fish #2 (black). (B) Cross-correlation diagram for the sequence shown in (A). Correlation coefficients are plotted color-coded for response times of M. rume ± 100 ms in relation to the playback signals over the experimental time. The red band at a response time of about 20 ms in the upper part of the diagram in (B) demonstrates a relatively high correlation between the discharges of fish #2 and the dummy fish at this latency and indicates that the test fish synchronized its discharge activity to the playback for a time period of several seconds.

